


 |
市场调查报告书
商品编码
1250855
美国厨房家具市场The Kitchen Furniture Market in the United States |
||||||
按出厂价计算,2022 年美国厨房家具市场价值约为 206 亿美元,同比增长 12%。 预计将在 2023 年下降,并在 2024/2025 年再次增长。
美国长期以来一直是世界上最大的厨房家具进口国,到 2022 年将进口价值 30 亿美元的厨房家具。 越南、加拿大和马来西亚是美国市场厨房家具的主要供应商。 此外,从意大利和德国的进口额约为 2 亿美元。 高端市场按价值约占30%,通过厨房专卖店的分销份额也相近27%。 超过50%的市场被60家大公司占据。
在这份报告中,我们研究分析了美国厨房家具市场、供需、厨房家具的交易趋势和预测、8个地区和6个价格区间的销售数据、主要公司的市场份额、公司概况和市场营销策略、分布分析等。
亮点
内容
介绍
基础数据
- 厨房家具的生产、出口、进口和消费的价值和数量
- 按价格区间细分的厨房家具市场数量、数量和平均价格
活动趋势和预测
- 厨房家具的生产、出口、进口和消费(2016-2022 年估计数据)
- 厨房家具市场的预计增长率:价值、数量、平均价格(2021-2022 年预计数据和 2023-2025 年预测)
国际贸易
- 厨房家具的进出口值:按国家/地区、目的地/原产地(2017-2022 年)
- 主要家用电器(冰箱/冰柜、炊具、抽油烟机、洗碗机、洗衣机/干衣机)的进出口值(2017-2022 年)
供应结构
- 定制库存柜
- 厨房家具供应明细:按橱柜类型(定制、半定制、库存)
- 样式、材料和颜色
- 厨房家具供应明细:按风格(传统、过渡/现代、当代)
- 厨房家具供应明细:按柜门材料
- 檯面
- 厨房家具供应明细:按檯面材料
- 製造基地
- 位置:按州
- 就业和成本
- 主要样本公司的员工人数(2016 年、2018 年、2020 年、2022 年)
- 家用电器、炊具、照明
分布
- 区域销售
- 预计消费:按州分类
- 分销渠道
- 样本公司按分销渠道划分的厨具销售估计细目
- 改革
- 设计中心、承包商、室内设计师
- 厨房改造流程及付款方式
衝突
- 主要公司:在美国製造和销售厨房家具
- 美国 60 家主要公司的厨房家具产量和市场份额
- 美国 60 家主要公司的厨房家具销售额和市场份额
- 主要样本公司的厨房家具销售额和市场份额:按价格区间(低端、中低端、中端、中高端、高端、豪华)
- 主要公司:按地区划分的销售额
- 样本主要公司的厨房家具销售额和市场份额:按地区(新英格兰、中东、五大湖、平原、东南部、西南、落基山脉、西海岸)
需求决定因素
- 建筑活动的特征、宏观经济指标和人口统计数据
美国厨房家具店 (2000) 联繫人
美国市场主要厨房家具公司联繫方式
The report "The Kitchen Furniture Market in the United States", now in its eighth edition, offers a comprehensive analysis of the kitchen furniture sector in the US, providing trends and forecasts of supply, demand and trade of kitchen furniture, sales data and market shares of leading players by eight geographic regions and six price ranges, company profiles, marketing strategies and distribution analysis.
The study has been processed using the following data sources:
- Information collected on approximately 100 manufacturers and suppliers of kitchen furniture and components operating in the US. The information was gathered either through active participation (direct replies to an interview or completion of a questionnaire) or through company balance sheets, figures and estimates.
- Analysis of CSIL databases for kitchen furniture in the United States and worldwide.
- Official economic statistics and international trade data.
- General documentation relating to the kitchen industry is available both online and offline.
The analysis of the US kitchen furniture imports and exports is provided by country and by geographical area of destination/origin, for the period 2017-2022.
The kitchen furniture production in the United States is broken down by type of cabinet, style, cabinet door material, and countertop material for a sample of companies.
The analysis of kitchen furniture distribution in the US market covers the following channels: Kitchen specialists, Home improvement, Builders, Contract, and Furniture stores/chains. An Excel directory of around 2,000 kitchen furniture stores in the US (specialists, chains, distributors) is delivered together with this report.
An overview of the construction and real estate market, as well as figures on population and disposable income in the United States, are also included.
The chapter on the competitive system analyses the main manufacturers and distributors active in the US kitchen furniture market, providing short company profiles, data on kitchen furniture sales by price range and geographic region, and market shares.
The United States has been divided into the following regions:
- New England: Connecticut, Maine, Massachusetts, New Hampshire, Rhode Island, Vermont
- Mideast: Delaware, District of Columbia, Maryland, New Jersey, New York, Pennsylvania
- Great Lakes: Illinois, Indiana, Michigan, Ohio, Wisconsin
- Plains: Iowa, Kansas, Minnesota, Missouri, Nebraska, North Dakota, South Dakota
- Southeast: Alabama, Arkansas, Florida, Georgia, Kentucky, Louisiana, Mississippi, North Carolina, South Carolina, Tennessee, Virginia, West Virginia
- Southwest: Arizona, New Mexico, Oklahoma, Texas
- Rocky Mountain: Colorado, Idaho, Montana, Utah, Wyoming
- West Coast: Alaska, California, Hawaii, Nevada, Oregon, Washington
SELECTED COMPANIES
Among US Kitchen Furniture Market Top Players: Adornus, American Woodmark, AyA Kitchens and Baths, Barbosa Cabinets, Bellmont Cabinet, Bernier Cabinetry, Boffi, Bridgewood Cabinetry, Cabinetworks Group, Candlelight Cabinetry, Canyon Creek Cabinet, Covered Bridge Cabinetry, Crystal Cabinet, Dakota Kitchen & Bath, DeWils, Dura Supreme, Fabuwood Cabinetry, Haas Cabinet, Haecker, Holiday Kitchens, Home Depot, Huntwood Industries, Ikea, Innocraft Cabinetry, Kent Moore Cabinets, Kitchen Cabinet Distributors, Kith Kitchens, Kountry Kraft Kitchens, Kountry Wood Products, LaFata Cabinets, Lanz Cabinets, Leedo Cabinetry, Legacy Cabinets, Lowe's, Marsh Furniture, MasterBrand Cabinets, Nations Cabinetry, Nobilia, Plain & Fancy, QCCI Quality Custom Cabinetry, Rutt HandCrafted Cabinetry, Scavolini, Showplace Wood Products, Signature Custom Cabinetry, StarMark Cabinetry, Tru Cabinetry, Wellborn Cabinet, WF Cabinetry, Wolf Home Products, Woodharbor, Woodmont Cabinetry, Wren Kitchens USA, WW Wood Products
Highlights:
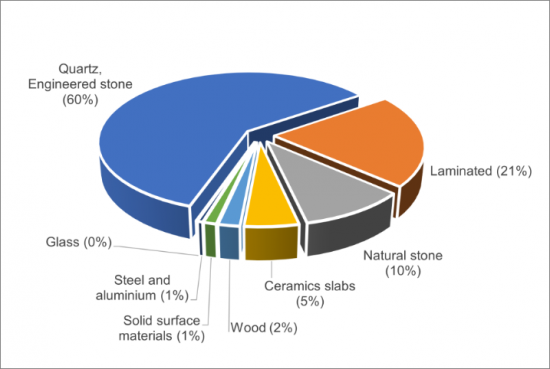
USA: Kitchen furniture supply by worktop material
According to CSIL the US kitchen furniture market in 2022 is worth around 20.6 billion USD at factory prices, with a 12% growth in value on the previous year. The market is expected to decrease in 2023, and growing again in 2024 and 2025.
The United States is by far the leading importer of kitchen furniture worldwide for a long time, importing US$ 3 billion worth of kitchen furniture in 2022. Vietnam, Canada and Malaysia are the main suppliers of kitchen furniture to the American market. Around 200 million USD of imports from Italy and Germany.
The upper-end market accounts for around 30% in value (700 thousand kitchens, on a total of over 8 million units). Similar (27%) share of distribution through kitchen specialists. The top 60 players hold more than 50% of the market. Sales data, market shares and short company profiles are given for 6 price ranges and 8 geographic regions.
A directory of around 2,000 kitchen furniture stores in the US is provided given in Excel annex, together with the report.
TABLE OF CONTENTS
INTRODUCTION
- Research Tools, Terminology and methodological notes
BASIC DATA
- United States. Kitchen furniture production, exports, imports and consumption, in value and volume
- United States. Kitchen furniture market breakdown by price ranges, in value and volume and average price
ACTIVITY TREND AND FORECAST
- United States. Kitchen furniture production, exports, imports and consumption, 2016-2022 estimated data
- United States. Kitchen furniture. Estimated percentage growth of the market: values, volumes and average prices. Estimated data 2021-2022 and forecast 2023-2025
INTERNATIONAL TRADE
- United States. Exports and imports of kitchen furniture by country and by geographical area of destination/origin, 2017-2022
- United States. Exports and imports of major appliances (Refrigerators and freezers, Cooking appliances, Hoods, Dishwashers, Clothes washers and driers), 2017-2022
SUPPLY STRUCTURE
- Custom and stock cabinets
- United States. Breakdown of kitchen furniture supply by type of cabinet: custom, semi-custom, stock
- Styles, materials and colours
- United States. Breakdown of kitchen furniture supply by style: traditional, transitional/modern, contemporary
- United States. Breakdown of kitchen furniture supply by cabinet door material
- Countertops
- United States. Breakdown of kitchen furniture supply by worktop material
- Manufacturing presence
- United States. Kitchen furniture. Establishments by State
- United States. Kitchen furniture. Employment and costs
- United States. Number of employees for a sample of leading companies, 2016, 2018, 2020, 2022
- Appliances, Cookware, Lighting
DISTRIBUTION
- Regional sales
- United States. Kitchen furniture. Estimated consumption by State
- Distribution channels
- United States. Estimated breakdown of Kitchens sales by distribution channel in a sample of companies
- Home Improvement
- Design centers, contractors, interior decorators
- Kitchen Remodelling process and Payment options
COMPETITION
- Top players. Kitchen furniture production and sales in the US
- United States. Kitchen furniture production and market shares of 60 among the leading US companies
- Kitchen furniture sales in the US and market shares of 60 among the leading companies
- United States. Kitchen furniture sales and market share in a sample of leading companies by price range (Low end, Middle-low, Middle end, Middle-upper, Upper-end, luxury)
- Top players. Geographical sales
- United States. Kitchen furniture sales and market share in a sample of leading companies by geographic region (New England, Mid East, Great Lakes, Plains, South East, South West, Rocky Mountain, West Coast)
DEMAND DETERMINANTS
- Construction activity, Macroeconomic indicators, Demographics features
DIRECTORY OF 2000 US KITCHEN FURNITURE STORES
- An Excel directory of around 2,000 kitchen furniture stores in the US (specialists, chains, distributors) is delivered together with this report


