


 |
市场调查报告书
商品编码
1097873
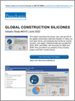
建设用全球硅胶市场Global Construction Silicones |
||||||
价格
建设用硅胶的全球的需求,预计到2025年以金额为准年度成长7.0%。由于全球建设活动的加速,成熟市场的北美和西欧需求也增加,以及基础设施的建设,维修,改装的投资成长,也预期带给该市场需求恩惠。再加上受到黏剂、密封胶、炼製焦化剂、硅胶为基础产品的性能所牵引,有望继续成为最大的功能性产品。
本报告提供全球建设用硅胶市场调查,各市场、各功能、各地区的分析,过去资料与预测,主要企业等资讯。
目录
第1章 摘要整理
第2章 本报告
- 本报告详细内容
- 调查范围与产品的说明
- COVID-19大流行的影响
第3章 概要
- 过去的市场趋势
- 需求:各地区
- 主要国家的市场
- 成长快速国家的市场
- 硅胶产品
- 需求:各类型
- 硅橡胶
- 硅胶树脂
- 硅胶油
- 市场占有率与主要生产者
第4章 硅胶的建设用途
- 需求:各建设产品
- 黏剂、密封胶、炼製焦化剂
- 油漆和涂料
- 其他
第5章 北美
- 北美 - 建设用硅胶市场规模和过去趋势
- 北美 - 需求:各类型、各建设用途
- 美国
- 加拿大
- 墨西哥
第6章 中南美
- 中南美 - 建设用硅胶市场规模和过去趋势
- 中南美 - 需求:各类型、各建设用途
- 巴西
- 其他
第7章 西欧
- 西欧 - 建设用硅胶市场规模和过去趋势
- 西欧 - 需求:各类型、各建设用途
- 德国
- 法国
- 英国
- 西班牙
- 义大利
- 其他
第8章 东欧
- 东欧 - 建设用硅胶市场规模和过去趋势
- 东欧 - 需求:各类型、各建设用途
- 俄罗斯
- 其他
第9章 亚洲/太平洋
- 亚洲/太平洋 - 建设用硅胶市场规模和过去趋势
- 亚洲/太平洋 - 需求:各类型、各建设用途
- 中国
- 日本
- 印度
- 韩国
- 台湾
- 其他
第10章 非洲/中东
- 非洲/中东 - 建设用硅胶市场规模和过去趋势
- 非洲/中东 - 需求:各类型、各建设用途
第11章 附录
- 范围
- 定义
- 调查手法
- 特定研究的调查手法
- 资讯来源
- 协会和机关
- 相关研究和报告
- 国家清单:各地区
- 宏观经济的前提条件
- 世界经济预测
- 世界人口
- 全球建设预测
Product Code: 4315
This report examines the scope, size, and growth of the global construction silicones industry in metric ton and value terms, and analyzes key trends by market, function, and region. Historical data are provided for 2010, 2015, and 2020, with forecasts for 2025 and 2030. Also provided is an analysis of key industry players and their market shares.
Study Highlights include:
- Global demand for construction silicones is expected to grow 7.0% per year in value terms through 2025.
- An acceleration in construction activity worldwide will boost demand, even in the mature markets of North America and Western Europe
- Growth in investment in infrastructure construction, repair, and improvement will also benefit demand for construction silicones.
- Adhesives, sealants, and caulks will remain the largest functional class, with demand driven by the performance of silicone-based products.
Table of Contents
1. Executive Summary
2. About This Report
- Report Details
- Study Scope & Product Description
- Impact of COVID-19 Pandemic
3. Overview
- Historical Market Trends
- Demand by Region
- Leading Country Markets
- Fastest Growing Country Markets
- Silicones Products
- Demand by Type
- Silicone Elastomers
- Silicone Resins
- Silicone Fluids
- Market Share & Leading Producers
4. Construction Uses for Silicones
- Demand by Construction Product
- Adhesives, Sealants, & Caulks
- Paints & Coatings
- Other Construction Products
5. North America
- North America: Construction Silicone Market Size & Historical Trends
- North America: Demand by Type & Construction Use
- United States
- United States: Construction Silicone Market Size & Historical Trends
- United States: Demand by Type
- Canada
- Canada: Construction Silicone Market Size & Historical Trends
- Canada: Demand by Type
- Mexico
- Mexico: Construction Silicone Market Size & Historical Trends
- Mexico: Demand by Type
6. Central & South America
- Central & South America: Construction Silicone Market Size & Historical Trends
- Central & South America: Demand by Type & Construction Use
- Brazil
- Brazil: Construction Silicone Market Size & Historical Trends
- Brazil: Demand by Type
- Other Central & South America
- Other Central & South America: Construction Silicone Market Size & Historical Trends
- Other Central & South America: Demand by Type
7. Western Europe
- Western Europe: Construction Silicone Market Size & Historical Trends
- Western Europe: Demand by Type & Construction Use
- Germany
- Germany: Construction Silicone Market Size & Historical Trends
- Germany: Demand by Type
- France
- France: Construction Silicone Market Size & Historical Trends
- France: Demand by Type
- United Kingdom
- United Kingdom: Construction Silicone Market Size & Historical Trends
- United Kingdom: Demand by Type
- Spain
- Spain: Construction Silicone Market Size & Historical Trends
- Spain: Demand by Type
- Italy
- Italy: Construction Silicone Market Size & Historical Trends
- Italy: Demand by Type
- Other Western Europe
- Other Western Europe: Construction Silicone Market Size & Historical Trends
- Other Western Europe: Demand by Type
8. Eastern Europe
- Eastern Europe: Construction Silicone Market Size & Historical Trends
- Eastern Europe: Demand by Type & Construction Use
- Russia
- Russia: Construction Silicone Market Size & Historical Trends
- Russia: Demand by Type
- Other Eastern Europe
- Other Eastern Europe: Construction Silicone Market Size & Historical Trends
- Other Eastern Europe: Demand by Type
9. Asia/Pacific
- Asia/Pacific: Construction Silicone Market Size & Historical Trends
- Asia/Pacific: Demand by Type & Construction Use
- China
- China: Construction Silicone Market Size & Historical Trends
- China: Demand by Type
- Japan
- Japan: Construction Silicone Market Size & Historical Trends
- Japan: Demand by Type
- India
- India: Construction Silicone Market Size & Historical Trends
- India: Demand by Type
- South Korea
- South Korea: Construction Silicone Market Size & Historical Trends
- South Korea: Demand by Type
- Taiwan
- Taiwan: Construction Silicone Market Size & Historical Trends
- Taiwan: Demand by Type
- Other Asia/Pacific
- Other Asia/Pacific: Construction Silicone Market Size & Historical Trends
- Other Asia/Pacific: Demand by Type
10. Africa/Mideast
- Africa/Mideast: Construction Silicone Market Size & Historical Trends
- Africa/Mideast: Demand by Type & Construction Use
11. Appendix
- Scope
- Definitions
- Freedonia Methodology
- Study-Specific Methodology
- Sources
- Associations & Agencies
- Related Studies & Reports
- Country Lists by Region
- Macroeconomic Assumptions
- Global Economic Outlook
- Global Population
- Global Construction Outlook
List of Tables
2. About This Report
- Table 2-1 Global Construction Silicones Demand by Region, 2019 - 2022 (million dollars)
3. Overview
- Table 3-1 Global Construction Silicones Demand, 2010 - 2021 (thousand metric tons & million dollars)
- Table 3-2 Global Construction Silicones Demand by Region, 2010 - 2030 (million dollars & thousand metric tons)
- Table 3-3 Global Construction Silicones Demand by Type, 2010 - 2030 (million dollars & thousand metric tons)
- Table 3-4 Global Construction Silicone Elastomers Demand by Region, 2010 - 2030 (million dollars & thousand metric tons)
- Table 3-5 Global Construction Silicone Elastomers Demand by Region, 2010 - 2030 (thousand metric tons)
- Table 3-6 Global Construction Silicone Resins Demand by Region, 2010 - 2030 (million dollars & thousand metric tons)
- Table 3-7 Global Construction Silicone Resins Demand by Region, 2010 - 2030 (thousand metric tons)
- Table 3-8 Global Construction Silicone Fluids Demand by Region, 2010 - 2030 (million dollars & thousand metric tons)
- Table 3-9 Global Construction Silicones Fluids Demand by Region, 2010 - 2030 (thousand metric tons)
4. Construction Uses for Silicones
- Table 4-1 Global Construction Silicones Demand by Construction Product, 2010 - 2030 (million dollars)
- Table 4-2 Global Silicone Demand in Construction Adhesives, Sealants, & Caulks by Region, 2010 - 2030 (million dollars)
- Table 4-3 Global Silicones Demand in Construction Paints & Coatings by Region, 2010 - 2030 (million dollars)
- Table 4-4 Global Silicones Demand in Other Construction Products by Region, 2010 - 2030 (million dollars)
5. North America
- Table 5-1 North America: Construction Silicones Demand by Type & Construction Use, 2010 - 2030 (million dollars)
- Table 5-2 North America: Construction Silicones Demand by Type, 2010 - 2030 (thousand metric tons)
- Table 5-3 United States: Construction Silicones Demand by Type, 2010 - 2030 (million dollars & thousand metric tons)
- Table 5-4 United States: Construction Silicones Demand by Type, 2010 - 2030 (thousand metric tons)
- Table 5-5 Canada: Construction Silicones Demand by Type, 2010 - 2030 (million US dollars & thousand metric tons)
- Table 5-6 Canada: Construction Silicones Demand by Type, 2010 - 2030 (thousand metric tons)
- Table 5-7 Mexico: Construction Silicones Demand by Type, 2010 - 2030 (million dollars & thousand metric tons)
- Table 5-8 Mexico: Construction Silicones Demand by Type, 2010 - 2030 (thousand metric tons)
6. Central & South America
- Table 6-1 Central & South America: Construction Silicones Demand by Type & Construction Use, 2010 - 2030 (million dollars)
- Table 6-2 Central & South America: Construction Silicones Demand by Type, 2010 - 2030 (thousand metric tons)
- Table 6-3 Brazil: Construction Silicones Demand by Type, 2010 - 2030 (million dollars & thousand metric tons)
- Table 6-4 Brazil: Construction Silicones Demand by Type, 2010 - 2030 (thousand metric tons)
- Table 6-5 Other Central & South America: Construction Silicones Demand by Type, 2010 - 2030 (million dollars & thousand metric tons)
- Table 6-6 Other Central & South America: Construction Silicones Demand by Type, 2010 - 2030 (thousand metric tons)
7. Western Europe
- Table 7-1 Western Europe: Construction Silicones Demand by Type & Construction Use, 2010 - 2030 (million dollars)
- Table 7-2 Western Europe: Construction Silicones Demand by Type, 2010 - 2030 (thousand metric tons)
- Table 7-3 Germany: Construction Silicones Demand by Type, 2010 - 2030 (million dollars & thousand metric tons)
- Table 7-4 Germany: Construction Silicones Demand by Type, 2010 - 2030 (thousand metric tons)
- Table 7-5 France: Construction Silicones Demand by Type, 2010 - 2030 (million dollars & thousand metric tons)
- Table 7-6 France: Construction Silicones Demand by Type, 2010 - 2030 (thousand metric tons)
- Table 7-7 United Kingdom: Construction Silicones Demand by Type, 2010 - 2030 (million dollars & thousand metric tons)
- Table 7-8 United Kingdom: Construction Silicones Demand by Type, 2010 - 2030 (thousand metric tons)
- Table 7-9 Spain: Construction Silicones Demand by Type, 2010 - 2030 (million dollars & thousand metric tons)
- Table 7-10 Spain: Construction Silicones Demand by Type, 2010 - 2030 (thousand metric tons)
- Table 7-11 Italy: Construction Silicones Demand by Type, 2010 - 2030 (million dollars & thousand metric tons)
- Table 7-12 Italy: Construction Silicones Demand by Type, 2010 - 2030 (thousand metric tons)
- Table 7-13 Other Western Europe: Construction Silicones Demand by Type, 2010 - 2030 (million dollars & thousand metric tons)
- Table 7-14 Other Western Europe: Construction Silicones Demand by Type, 2010 - 2030 (thousand metric tons)
8. Eastern Europe
- Table 8-1 Eastern Europe: Construction Silicones Demand by Type & Construction Use, 2010 - 2030 (million dollars)
- Table 8-2 Eastern Europe: Construction Silicones Demand by Type, 2010 - 2030 (thousand metric tons)
- Table 8-3 Russia: Construction Silicones Demand by Type, 2010 - 2030 (million dollars & thousand metric tons)
- Table 8-4 Russia: Construction Silicones Demand by Type, 2010 - 2030 (thousand metric tons)
- Table 8-5 Other Eastern Europe: Construction Silicones Demand by Type, 2010 - 2030 (million dollars & thousand metric tons)
- Table 8-6 Other Eastern Europe: Construction Silicones Demand by Type, 2010 - 2030 (thousand metric tons)
9. Asia/Pacific
- Table 9-1 Asia/Pacific: Construction Silicones Demand by Type & Construction Use, 2010 - 2030 (million dollars)
- Table 9-2 Asia/Pacific: Construction Silicones Demand by Type, 2010 - 2030 (thousand metric tons)
- Table 9-3 China: Construction Silicones Demand by Type, 2010 - 2030 (million dollars & thousand metric tons)
- Table 9-4 China: Construction Silicones Demand by Type, 2010 - 2030 (thousand metric tons)
- Table 9-5 Japan: Construction Silicones Demand by Type, 2010 - 2030 (million dollars & thousand metric tons)
- Table 9-6 Japan: Construction Silicones Demand by Type, 2010 - 2030 (thousand metric tons)
- Table 9-7 India: Construction Silicones Demand by Type, 2010 - 2030 (million dollars & thousand metric tons)
- Table 9-8 India: Construction Silicones Demand by Type, 2010 - 2030 (thousand metric tons)
- Table 9-9 South Korea: Construction Silicones Demand by Type, 2010 - 2030 (million dollars & thousand metric tons)
- Table 9-10 South Korea: Construction Silicones Demand by Type, 2010 - 2030 (thousand metric tons)
- Table 9-11 Taiwan: Construction Silicones Demand by Type, 2010 - 2030 (million US dollars & thousand metric tons)
- Table 9-12 Taiwan: Construction Silicones Demand by Type, 2010 - 2030 (thousand metric tons)
- Table 9-13 Other Asia/Pacific: Construction Silicones Demand by Type, 2010 - 2030 (million dollars & thousand metric tons)
- Table 9-14 Other Asia/Pacific: Construction Silicones Demand by Type, 2010 - 2030 (thousand metric tons)
10. Africa/Mideast
- Table 10-1 Africa/Mideast: Construction Silicones Demand by Type & Construction Use, 2010 - 2030 (million dollars & thousand metric tons)
- Table 10-2 Africa/Mideast: Construction Silicones Demand by Type, 2010 - 2030 (thousand metric tons)
11. Appendix
- Table 11-1 Relevant HS Codes
- Table 11-2 Relevant NACE Codes
- Table 11-3 Relevant NAICS & SIC Codes
- Table 11-4 Countries in North America
- Table 11-5 Countries in Central & South America
- Table 11-6 Countries in Western Europe
- Table 11-7 Countries in Eastern Europe
- Table 11-8 Countries in the Asia/Pacific Region
- Table 11-9 Countries in the Africa/Mideast Region
- Table 11-10 Global Gross Domestic Product by Region & Country, 2010 - 2030 (billion 2019 dollars)
- Table 11-11 Global Population by Region & Country, 2010 - 2030 (million persons)
- Table 11-12 Global Construction Expenditures by Region & Country, 2010 - 2030 (billion 2019 dollars)
List of Figures
1. Executive Summary
- Figure 1-1 Construction Silicones Global Market Outlook
2. About This Report
- Figure 2-1 Global Construction Silicones Demand, 2018 - 2023 (million dollars)
3. Overview
- Figure 3-1 Global Construction Silicones Demand, 2004 - 2021 (thousand metric tons)
- Figure 3-2 Global Construction Silicones Value Demand by Region, 2015 - 2025 (% CAGR)
- Figure 3-3 Construction Silicones: Leading Country Markets, 2020 (million dollars)
- Figure 3-4 Construction Silicones: Fastest Growing Country Markets, 2020 - 2025 (% CAGR)
- Figure 3-5 Global Construction Silicones Demand by Type, 2010 - 2030 (thousand metric tons)
4. Construction Uses for Silicones
- Figure 4-1 Global Construction Silicones Demand by Construction Product, 2010 - 2030 (million dollars)
5. North America
- Figure 5-1 North America: Construction Silicones Market Key Indicators, 2020
- Figure 5-2 North America: Construction Silicones Demand, 2005 - 2020 (thousand metric tons)
- Figure 5-3 North America: Construction Silicones Demand Share by Type, 2010 - 2030 (million dollars)
- Figure 5-4 United States: Construction Silicones Market Key Indicators, 2020
- Figure 5-5 United States: Construction Silicones Demand, 2005 - 2020 (thousand metric tons)
- Figure 5-6 Canada: Construction Silicones Market Key Indicators, 2020
- Figure 5-7 Canada: Construction Silicones Demand, 2005 - 2020 (thousand metric tons)
- Figure 5-8 Mexico: Construction Silicones Market Key Indicators, 2020
- Figure 5-9 Mexico: Construction Silicones Demand, 2005 - 2020 (thousand metric tons)
6. Central & South America
- Figure 6-1 Central & South America: Construction Silicones Market Key Indicators, 2020
- Figure 6-2 Central & South America: Construction Silicones Demand, 2005 - 2020 (thousand metric tons)
- Figure 6-3 Central & South America: Construction Silicones Demand Share by Type, 2010 - 2030 (million dollars)
- Figure 6-4 Brazil: Construction Silicones Market Key Indicators, 2020
- Figure 6-5 Brazil: Construction Silicones Demand, 2005 - 2020 (thousand metric tons)
- Figure 6-6 Other Central & South America: Construction Silicones Market Key Indicators, 2020
- Figure 6-7 Other Central & South America: Construction Silicones Demand, 2005 - 2020 (thousand metric tons)
7. Western Europe
- Figure 7-1 Western Europe: Construction Silicones Market Key Indicators, 2020
- Figure 7-2 Western Europe: Construction Silicones Demand, 2005 - 2020 (thousand metric tons)
- Figure 7-3 Western Europe: Construction Silicones Demand Share by Type, 2010 - 2030 (million dollars)
- Figure 7-4 Germany: Construction Silicones Market Key Indicators, 2020
- Figure 7-5 Germany: Construction Silicones Demand, 2005 - 2020 (thousand metric tons)
- Figure 7-6 France: Construction Silicones Market Key Indicators, 2020
- Figure 7-7 France: Construction Silicones Demand, 2005 - 2020 (thousand metric tons)
- Figure 7-8 United Kingdom: Construction Silicones Market Key Indicators, 2020
- Figure 7-9 United Kingdom: Construction Silicones Demand, 2005 - 2020 (thousand metric tons)
- Figure 7-10 Spain: Construction Silicones Market Key Indicators, 2020
- Figure 7-11 Spain: Construction Silicones Demand, 2005 - 2020 (thousand metric tons)
- Figure 7-12 Italy: Construction Silicones Market Key Indicators, 2020
- Figure 7-13 Italy: Construction Silicones Demand, 2005 - 2020 (thousand metric tons)
- Figure 7-14 Other Western Europe: Construction Silicones Market Key Indicators, 2020
- Figure 7-15 Other Western Europe: Construction Silicones Demand, 2005 - 2020 (thousand metric tons)
8. Eastern Europe
- Figure 8-1 Eastern Europe: Construction Silicones Market Key Indicators, 2020
- Figure 8-2 Eastern Europe: Construction Silicones Demand, 2005 - 2020 (thousand metric tons)
- Figure 8-3 Eastern Europe: Construction Silicones Demand Share by Type, 2010 - 2030 (million dollars)
- Figure 8-4 Russia: Construction Silicones Market Key Indicators, 2020
- Figure 8-5 Russia: Construction Silicones Demand, 2005 - 2020 (thousand metric tons)
- Figure 8-6 Other Eastern Europe: Construction Silicones Market Key Indicators, 2020
- Figure 8-7 Other Eastern Europe: Construction Silicones Demand, 2005 - 2020 (thousand metric tons)
9. Asia/Pacific
- Figure 9-1 Asia/Pacific: Construction Silicones Market Key Indicators, 2020
- Figure 9-2 Asia/Pacific: Construction Silicones Demand, 2005 - 2020 (thousand metric tons)
- Figure 9-3 Asia/Pacific: Construction Silicones Demand Share by Type, 2010 - 2030 (million dollars)
- Figure 9-4 China: Construction Silicones Market Key Indicators, 2020
- Figure 9-5 China: Construction Silicones Demand, 2005 - 2020 (thousand metric tons)
- Figure 9-6 Japan: Construction Silicones Market Key Indicators, 2020
- Figure 9-7 Japan: Construction Silicones Demand, 2005 - 2020 (thousand metric tons)
- Figure 9-8 India: Construction Silicones Market Key Indicators, 2020
- Figure 9-9 India: Construction Silicones Demand, 2005 - 2020 (thousand metric tons)
- Figure 9-10 South Korea: Construction Silicones Market Key Indicators, 2020
- Figure 9-11 South Korea: Construction Silicones Demand, 2005 - 2020 (thousand metric tons)
- Figure 9-12 Taiwan: Construction Silicones Market Key Indicators, 2020
- Figure 9-13 Taiwan: Construction Silicones Demand, 2005 - 2020 (thousand metric tons)
- Figure 9-14 Other Asia/Pacific: Construction Silicones Market Key Indicators, 2020
- Figure 9-15 Other Asia/Pacific: Construction Silicones Demand, 2005 - 2020 (thousand metric tons)
10. Africa/Mideast
- Figure 10-1 Africa/Mideast: Construction Silicones Market Key Indicators, 2020
- Figure 10-2 Africa/Mideast: Construction Silicones Demand, 2005 - 2020 (thousand metric tons)
- Figure 10-3 Africa/Mideast: Construction Silicones Demand Share by Type, 2010 - 2030 (million dollars)
02-2729-4219
+886-2-2729-4219
 填缝剂、水泥浆和接缝化合物市场:材料类型、干燥能力、类型、应用和最终用户 - 2024-2030 年全球预测
 建筑硅胶密封胶市场:按类型、固化类型、应用、最终用途 - 2024-2030 年全球预测
 2024-2028年外装硅胶填缝剂全球市场
 全球有机硅密封剂市场规模研究与预测,按技术(室温硫化、热固性或热固化、辐射固化、压力敏感)、应用和区域分析,2023-2030年
 硅酮密封胶市场规模、份额、趋势分析报告:按技术、应用(建筑、中空玻璃、汽车、其他)、地区、细分市场趋势,2023-2030 年
 全球有机硅密封胶市场——行业规模、份额、趋势、机会、预测、技术分析、应用、地区和竞争 (2018-2028F)
 硅胶密封胶的全球市场:2016-2032年
 全球有机硅密封胶市场——市场规模、份额、COVID-19 影响和到 2028 年的预测
 硅胶黏剂的全球市场
 硅胶系黏剂的全球市场(2016年~2032年)
▼