


 |
市场调查报告书
商品编码
1667183
肿瘤学市场机会、成长动力、产业趋势分析与 2025 - 2034 年预测Oncology Market Opportunity, Growth Drivers, Industry Trend Analysis, and Forecast 2025 - 2034 |
||||||
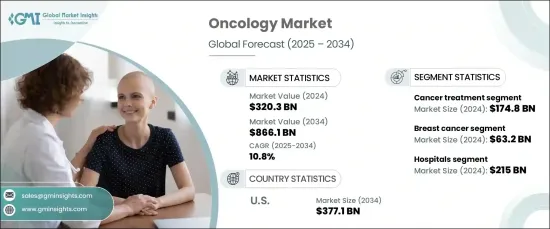
2024 年全球肿瘤市场规模达到 3,203 亿美元,预计 2025 年至 2034 年的复合年增长率为 10.8%。肿瘤学研究的进展旨在揭示癌症的根本原因和发展,推动创新治疗方法的发展并改善患者的治疗效果。
市场分为癌症诊断和癌症治疗。癌症诊断包括影像、活检、肿瘤生物标记测试、液体活检、免疫组织化学和原位杂交。同时,癌症治疗领域涵盖化疗、标靶治疗、免疫治疗、荷尔蒙治疗和其他干预措施。 2024 年,由于全球癌症负担不断增加,癌症治疗领域将占据最大的市场份额,达到 54.6%。这种成长归因于人口老化、生活方式的改变和环境因素。吸烟、不良饮食、缺乏运动和接触污染物是导致全球癌症发生率上升的主要原因。
| 市场范围 | |
|---|---|
| 起始年份 | 2024 |
| 预测年份 | 2025-2034 |
| 起始值 | 3203亿美元 |
| 预测值 | 8661亿美元 |
| 复合年增长率 | 10.8% |
市场根据癌症类型进一步分类,包括乳癌、肺癌、摄护腺癌、大肠癌、胃癌、肝癌、食道癌和其他癌症。其中,乳癌仍然是收入领先的领域,这得益于其发病率不断上升以及对早期发现和治疗进步的日益关注。造成这现象的因素包括遗传倾向、人口老化以及生活方式的转变。对癌症研究和医疗保健基础设施的大量投资,特别是在新兴市场,进一步改善了获得先进诊断和治疗的机会。这些努力正在加速市场成长并加强全球患者护理。
随着癌症发生率的上升,美国肿瘤学市场可望大幅成长。人口老化和生活方式风险等因素对医疗保健系统提出了更高的要求,推动了对先进治疗和诊断技术的需求。癌症负担日益加重,促使製药公司、医院和研究机构创新并开发更有效的治疗方法、诊断方法和支援服务。
目录
第 1 章:方法论与范围
第 2 章:执行摘要
第 3 章:产业洞察
- 产业生态系统分析
- 产业衝击力
- 成长动力
- 全球癌症发生率上升
- 政府和其他组织采取多项措施传播疾病意识
- 发展中国家诊断实验室数量不断增加
- 已开发国家的技术进步
- 产业陷阱与挑战
- 诊断影像系统相关资本投入高,成本高
- 癌症治疗相关的副作用风险和 CT 扫描仪相关风险较高
- 缺乏技术精湛、训练有素的肿瘤科医生和放射科医生
- 成长动力
- 成长潜力分析
- 监管格局
- 技术格局
- 未来市场趋势
- 差距分析
- 波特的分析
- PESTEL 分析
第四章:竞争格局
- 介绍
- 公司市占率分析
- 公司矩阵分析
- 主要市场参与者的竞争分析
- 竞争定位矩阵
- 策略仪表板
第 5 章:市场估计与预测:按癌症诊断与治疗,2021 年 - 2034 年
- 主要趋势
- 癌症诊断
- 肿瘤生物标记检测
- 影像学
- 活检
- 液体活检
- 免疫组织化学
- 原位杂交
- 癌症治疗
- 化疗
- 标靶治疗
- 免疫疗法
- 荷尔蒙治疗
- 其他癌症治疗
第 6 章:市场估计与预测:按癌症类型,2021 年至 2034 年
- 主要趋势
- 肺癌
- 摄护腺癌
- 结肠和直肠癌
- 胃癌
- 食道癌
- 肝癌
- 乳癌
- 其他癌症类型
第 7 章:市场估计与预测:依最终用途,2021 年至 2034 年
- 主要趋势
- 医院
- 诊断实验室
- 诊断影像中心
- 学术界
- 专科诊所
- 其他最终用途
第 8 章:市场估计与预测:按地区,2021 年至 2034 年
- 主要趋势
- 北美洲
- 我们
- 加拿大
- 欧洲
- 德国
- 英国
- 法国
- 西班牙
- 义大利
- 波兰
- 瑞士
- 荷兰
- 亚太地区
- 中国
- 印度
- 日本
- 澳洲
- 韩国
- 泰国
- 印尼
- 越南
- 拉丁美洲
- 巴西
- 墨西哥
- 阿根廷
- 哥伦比亚
- 中东和非洲
- 南非
- 沙乌地阿拉伯
- 阿联酋
- 以色列
第九章:公司简介
- AbbVie
- Amgen
- AstraZeneca
- Bristol-Myers Squibb Company
- Eli Lilly and Company
- GE HealthCare Technologies
- Gilead Sciences
- GlaxoSmithKline
- Johnson & Johnson
- Merck & Co
- Novartis
- Pfizer
- F. Hoffmann-La Roche
- Sanofi
- Takeda Pharmaceutical Company Limited
The Global Oncology Market reached USD 320.3 billion in 2024 and is projected to grow at a CAGR of 10.8% from 2025 to 2034. Oncology, as a medical specialty, focuses on preventing, diagnosing, and treating cancer through a wide array of strategies, including surgical procedures, chemotherapy, radiotherapy, targeted therapies, and immunotherapy. Advances in oncology research aim to uncover the underlying causes and progression of cancer, driving the development of innovative treatments and improving patient outcomes.
The market is divided into cancer diagnostics and cancer treatment. Cancer diagnostics include imaging, biopsies, tumor biomarker tests, liquid biopsies, immunohistochemistry, and in situ hybridization. Meanwhile, the cancer treatment segment covers chemotherapy, targeted therapies, immunotherapy, hormonal therapy, and other interventions. In 2024, the cancer treatment segment held the largest market share at 54.6%, supported by a rising global cancer burden. This increase is attributed to aging populations, changing lifestyles, and environmental factors. Smoking, poor diets, physical inactivity, and exposure to pollutants are key contributors to the increasing incidence of cancer worldwide.
| Market Scope | |
|---|---|
| Start Year | 2024 |
| Forecast Year | 2025-2034 |
| Start Value | $320.3 Billion |
| Forecast Value | $866.1 Billion |
| CAGR | 10.8% |
The market is further categorized by cancer type, including breast, lung, prostate, colorectal, gastric, liver, esophageal, and other cancers. Among these, breast cancer remains a leading segment in terms of revenue, fueled by its rising prevalence and growing focus on early detection and treatment advancements. Contributing factors include genetic predisposition, aging demographics, and shifting lifestyle patterns. Substantial investments in cancer research and healthcare infrastructure, particularly in emerging markets, are further improving access to advanced diagnostics and therapies. These efforts are accelerating market growth and enhancing patient care globally.
U.S. oncology market is poised for substantial growth, driven by the rising incidence of cancer cases. Factors such as an aging population and lifestyle risks are placing significant demands on healthcare systems, fueling the need for advanced treatments and diagnostic technologies. The growing burden of cancer is encouraging pharmaceutical companies, hospitals, and research institutions to innovate and develop more effective therapies, diagnostics, and support services.
Table of Contents
Chapter 1 Methodology and Scope
- 1.1 Market scope and definitions
- 1.2 Research design
- 1.2.1 Research approach
- 1.2.2 Data collection methods
- 1.3 Base estimates and calculations
- 1.3.1 Base year calculation
- 1.3.2 Key trends for market estimation
- 1.4 Forecast model
- 1.5 Primary research and validation
- 1.5.1 Primary sources
- 1.5.2 Data mining sources
Chapter 2 Executive Summary
- 2.1 Industry 3600 Synopsis
Chapter 3 Industry Insights
- 3.1 Industry ecosystem analysis
- 3.2 Industry impact forces
- 3.2.1 Growth drivers
- 3.2.1.1 Rising incidence of cancer globally
- 3.2.1.2 Several initiatives undertaken by government and other organizations to spread disease awareness
- 3.2.1.3 Growing number of diagnostic laboratories in developing countries
- 3.2.1.4 Technological advancements in developed countries
- 3.2.2 Industry pitfalls and challenges
- 3.2.2.1 High capital investment coupled with high cost associated with diagnostic imaging system
- 3.2.2.2 High risk of side effects associated with cancer treatment and risks associated with CT scanners
- 3.2.2.3 Dearth of well-skilled and trained oncologists and radiologists
- 3.2.1 Growth drivers
- 3.3 Growth potential analysis
- 3.4 Regulatory landscape
- 3.5 Technological landscape
- 3.6 Future market trends
- 3.7 Gap analysis
- 3.8 Porter’s analysis
- 3.9 PESTEL analysis
Chapter 4 Competitive Landscape, 2024
- 4.1 Introduction
- 4.2 Company market share analysis
- 4.3 Company matrix analysis
- 4.4 Competitive analysis of major market players
- 4.5 Competitive positioning matrix
- 4.6 Strategy dashboard
Chapter 5 Market Estimates and Forecast, By Cancer Diagnostics and Treatment, 2021 – 2034 ($ Mn)
- 5.1 Key trends
- 5.2 Cancer diagnostics
- 5.2.1 Tumor biomarkers test
- 5.2.2 Imaging
- 5.2.3 Biopsy
- 5.2.4 Liquid biopsy
- 5.2.5 Immunohistochemistry
- 5.2.6 In situ hybridization
- 5.3 Cancer treatment
- 5.3.1 Chemotherapy
- 5.3.2 Targeted therapy
- 5.3.3 Immunotherapy
- 5.3.4 Hormonal therapy
- 5.3.5 Other cancer treatments
Chapter 6 Market Estimates and Forecast, By Cancer Type, 2021 – 2034 ($ Mn)
- 6.1 Key trends
- 6.2 Lung cancer
- 6.3 Prostate cancer
- 6.4 Colon and rectal cancer
- 6.5 Gastric cancer
- 6.6 Esophageal cancer
- 6.7 Liver cancer
- 6.8 Breast cancer
- 6.9 Other cancer types
Chapter 7 Market Estimates and Forecast, By End Use, 2021 – 2034 ($ Mn)
- 7.1 Key trends
- 7.2 Hospitals
- 7.3 Diagnostic laboratories
- 7.4 Diagnostic imaging centers
- 7.5 Academia
- 7.6 Specialty clinics
- 7.7 Other end use
Chapter 8 Market Estimates and Forecast, By Region, 2021 – 2034 ($ Mn)
- 8.1 Key trends
- 8.2 North America
- 8.2.1 U.S.
- 8.2.2 Canada
- 8.3 Europe
- 8.3.1 Germany
- 8.3.2 UK
- 8.3.3 France
- 8.3.4 Spain
- 8.3.5 Italy
- 8.3.6 Poland
- 8.3.7 Switzerland
- 8.3.8 Netherlands
- 8.4 Asia Pacific
- 8.4.1 China
- 8.4.2 India
- 8.4.3 Japan
- 8.4.4 Australia
- 8.4.5 South Korea
- 8.4.6 Thailand
- 8.4.7 Indonesia
- 8.4.8 Vietnam
- 8.5 Latin America
- 8.5.1 Brazil
- 8.5.2 Mexico
- 8.5.3 Argentina
- 8.5.4 Colombia
- 8.6 Middle East and Africa
- 8.6.1 South Africa
- 8.6.2 Saudi Arabia
- 8.6.3 UAE
- 8.6.4 Israel
Chapter 9 Company Profiles
- 9.1 AbbVie
- 9.2 Amgen
- 9.3 AstraZeneca
- 9.4 Bristol-Myers Squibb Company
- 9.5 Eli Lilly and Company
- 9.6 GE HealthCare Technologies
- 9.7 Gilead Sciences
- 9.8 GlaxoSmithKline
- 9.9 Johnson & Johnson
- 9.10 Merck & Co
- 9.11 Novartis
- 9.12 Pfizer
- 9.13 F. Hoffmann-La Roche
- 9.14 Sanofi
- 9.15 Takeda Pharmaceutical Company Limited
 2020-2026年医药及生物技术领域早期药物研发(EDR)合作条款及协议与全球学术和非营利组织的合作协议条款及条件:2021-2026全球动物保健合作协议条款及条件(2017-2026)全球特药合作与协议(2020-2026)医药和生技产业资产收购交易:2019-2026医药和生物技术领域临床阶段合作条款及协议(2020-2026)医药和生物技术领域的特许权使用费率(2015-2026)医药和生物技术领域的选择权和评估协议(2019-2026)製药和生物技术领域临床前合作的条款和条件(2020-2026)
 全球人工智慧肿瘤市场规模、份额、趋势和成长分析报告(2026-2034)