


 |
市场调查报告书
商品编码
1666960
桿式人工举升系统市场机会、成长动力、产业趋势分析及 2025 - 2034 年预测Rod Artificial Lift System Market Opportunity, Growth Drivers, Industry Trend Analysis, and Forecast 2025 - 2034 |
||||||
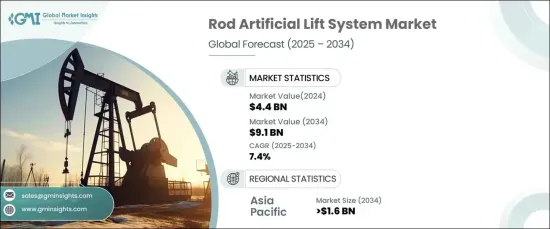
2024 年全球有桿人工举升系统市场价值为 44 亿美元,预计 2025 年至 2034 年期间的复合年增长率为 7.4%。随着操作员不断寻求适合不同井况且具有成本效益、可靠性和适应性的系统,对这些系统的需求正在日益增长,特别是在新油田和非常规储量的开发中。
技术进步也推动了市场扩张,包括自动化和提高系统耐用性和效率的增强材料。随着全球向永续能源解决方案的转变,对节能人工举升系统的推动进一步推动了市场需求。此外,能源基础设施投资的增加和良好的监管环境也促进了这些系统在主要地区迅速普及。
| 市场范围 | |
|---|---|
| 起始年份 | 2024 |
| 预测年份 | 2025-2034 |
| 起始值 | 44亿美元 |
| 预测值 | 91亿美元 |
| 复合年增长率 | 7.4% |
到 2034 年,亚太地区将为全球市场贡献 16 亿美元价值。随着中国、印度和东南亚等国家持续提高能源产量,这些系统对于维持成熟油井的最佳产量变得不可或缺。技术创新和政府对能源产业投资的支持进一步推动了这一需求。能源需求的成长以及对更永续开采过程的推动,确保这些系统将在该地区的石油和天然气领域发挥核心作用。
在北美,有桿人工举升系统市场预计在 2025 年至 2034 年间以 7% 的稳定速度成长。对于提高低压井产量的有效解决方案的需求正在促进市场的成长。技术进步,包括材料的改进以提高耐用性和即时监控的集成,也促进了市场的发展。此外,政府的优惠政策和对油田基础设施的大量投资正在加强该地区采用有桿人工举升系统。
美国有桿人工举升系统市场预计到 2034 年将创收 50 亿美元,并且越来越重视优化成熟油田和非常规油田的产量。随着营运商瞄准页岩油藏和老化油井,对经济高效、高性能解决方案的需求正在激增。材料强度和自动化程度的提高等技术创新正在支持这一趋势。对能源安全的需求不断增长,加上对油田基础设施的大量投资,进一步推动了市场扩张,使美国成为有桿人工举升系统市场的关键参与者。
目录
第 1 章:方法论与范围
- 市场定义
- 基础估算与计算
- 预测计算
- 资料来源
- 基本的
- 次要
- 有薪资的
- 民众
第 2 章:执行摘要
第 3 章:产业洞察
- 产业生态系统分析
- 监管格局
- 产业衝击力
- 成长动力
- 产业陷阱与挑战
- 成长潜力分析
- 波特的分析
- 供应商的议价能力
- 买家的议价能力
- 新进入者的威胁
- 替代品的威胁
- PESTEL 分析
第四章:竞争格局
- 战略仪表板
- 创新与永续发展格局
第五章:市场规模及预测:按地区,2021 – 2034 年
- 主要趋势
- 北美洲
- 我们
- 加拿大
- 欧洲
- 英国
- 挪威
- 荷兰
- 亚太地区
- 中国
- 印度
- 印尼
- 马来西亚
- 中东和非洲
- 沙乌地阿拉伯
- 阿联酋
- 阿曼
- 科威特
- 奈及利亚
- 拉丁美洲
- 巴西
- 阿根廷
- 墨西哥
第六章:公司简介
- BCP Group
- ChampionX
- ELKAM ArtEfficial Lift
- Endurance Lift Solutions International
- General Electric
- Halliburton
- JJ Tech
- Levare
- Liberty Lift Solutions
- National Energy Services Reunited
- NOV
- NOVA Petroleum Services
- PetroLift Systems
- Q2 Artificial Lift Services
- SLB
- Tenaris
- Weatherford
The Global Rod Artificial Lift System Market, valued at USD 4.4 billion in 2024, is projected to expand at a CAGR of 7.4% between 2025 and 2034. This significant growth is primarily driven by the increasing demand for efficient hydrocarbon extraction solutions from aging and low-pressure wells. As operators continue to seek cost-effective, reliable, and adaptable systems for varying well conditions, the need for these systems is growing, particularly in the development of new oilfields and unconventional reserves.
The market expansion is also being fueled by technological advancements, including automation and enhanced materials that improve system durability and efficiency. With a global shift toward sustainable energy solutions, the push for energy-efficient artificial lift systems is further propelling market demand. Additionally, heightened investments in energy infrastructure and favorable regulatory environments are contributing to the rapid adoption of these systems across key regions.
| Market Scope | |
|---|---|
| Start Year | 2024 |
| Forecast Year | 2025-2034 |
| Start Value | $4.4 Billion |
| Forecast Value | $9.1 Billion |
| CAGR | 7.4% |
The Asia Pacific region is set to contribute USD 1.6 billion to the global market value by 2034. The region's growing oil and gas exploration, particularly in aging fields and unconventional reservoirs, is accelerating the need for rod artificial lift systems. As countries like China, India, and those in Southeast Asia continue to boost energy production, these systems are becoming indispensable for maintaining optimal output from mature wells. Technological innovations and government support for energy sector investments are further driving this demand. The rise in energy demands, along with a push for more sustainable extraction processes, ensures that these systems will play a central role in the region's oil and gas sector.
In North America, the rod artificial lift systems market is poised to grow at a steady pace of 7% between 2025 and 2034. The expansion is largely driven by the increasing exploration and production activities in unconventional oil and gas reserves, especially in shale formations. The demand for efficient solutions to enhance output from low-pressure wells is contributing to the market growth. Technological advancements, including improvements in materials for increased durability and the integration of real-time monitoring, are also bolstering the market development. Furthermore, favorable government policies and substantial investments in oilfield infrastructure are reinforcing the adoption of rod artificial lift systems across the region.
The U.S. rod artificial lift systems market is anticipated to generate USD 5 billion by 2034, with a growing emphasis on optimizing production in both mature and unconventional oil fields. As operators target shale reservoirs and aging wells, the demand for cost-effective, high-performance solutions is surging. Technological innovations, such as advancements in material strength and automation for enhanced performance, are supporting this trend. The rising need for energy security, coupled with significant investments in oilfield infrastructure, is further driving market expansion, positioning the U.S. as a key player in the rod artificial lift systems market.
Table of Contents
Chapter 1 Methodology & Scope
- 1.1 Market definitions
- 1.2 Base estimates & calculations
- 1.3 Forecast calculation
- 1.4 Data sources
- 1.4.1 Primary
- 1.4.2 Secondary
- 1.4.2.1 Paid
- 1.4.2.2 Public
Chapter 2 Executive Summary
- 2.1 Industry synopsis, 2021 - 2034
Chapter 3 Industry Insights
- 3.1 Industry ecosystem analysis
- 3.2 Regulatory landscape
- 3.3 Industry impact forces
- 3.3.1 Growth drivers
- 3.3.2 Industry pitfalls & challenges
- 3.4 Growth potential analysis
- 3.5 Porter's analysis
- 3.5.1 Bargaining power of suppliers
- 3.5.2 Bargaining power of buyers
- 3.5.3 Threat of new entrants
- 3.5.4 Threat of substitutes
- 3.6 PESTEL analysis
Chapter 4 Competitive Landscape, 2024
- 4.1 Strategic dashboard
- 4.2 Innovation & sustainability landscape
Chapter 5 Market Size and Forecast, By Region, 2021 – 2034 (USD Million)
- 5.1 Key trends
- 5.2 North America
- 5.2.1 U.S.
- 5.2.2 Canada
- 5.3 Europe
- 5.3.1 UK
- 5.3.2 Norway
- 5.3.3 Netherlands
- 5.4 Asia Pacific
- 5.4.1 China
- 5.4.2 India
- 5.4.3 Indonesia
- 5.4.4 Malaysia
- 5.5 Middle East & Africa
- 5.5.1 Saudi Arabia
- 5.5.2 UAE
- 5.5.3 Oman
- 5.5.4 Kuwait
- 5.5.5 Nigeria
- 5.6 Latin America
- 5.6.1 Brazil
- 5.6.2 Argentina
- 5.6.3 Mexico
Chapter 6 Company Profiles
- 6.1 BCP Group
- 6.2 ChampionX
- 6.3 ELKAM ArtEfficial Lift
- 6.4 Endurance Lift Solutions International
- 6.5 General Electric
- 6.6 Halliburton
- 6.7 JJ Tech
- 6.8 Levare
- 6.9 Liberty Lift Solutions
- 6.10 National Energy Services Reunited
- 6.11 NOV
- 6.12 NOVA Petroleum Services
- 6.13 PetroLift Systems
- 6.14 Q2 Artificial Lift Services
- 6.15 SLB
- 6.16 Tenaris
- 6.17 Weatherford
 2026-2034年全球人工油脂萃取系统市场规模、份额、趋势及成长分析报告
 2026年全球陆上人工举升市场报告2026年全球人工举升系统市场报告
 桿式起重系统市场 - 全球产业规模、份额、趋势、机会、预测:按类型、最终用户、地区和竞争格局划分,2021-2031年陆基人工举升系统市场-全球产业规模、份额、趋势、机会与预测:按技术、最终用户、地区和竞争对手划分,2021-2031年全球人工举升系统市场:市场规模、占有率、成长率、产业分析、类型、应用及区域分析、未来预测(2026-2034)人工举升系统市场-2026-2031年预测海上取芯系统市场-全球产业规模、份额、趋势、机会及预测(按类型(底部取芯和侧壁取芯)、地区和竞争格局划分,2021-2031年预测)
 人工泵送系统市场规模、份额和成长分析(按产品、组件、井类型、技术、机制和地区划分)-2026-2033年产业预测人工举升市场-全球产业规模、份额、趋势、机会和预测,依举升类型、应用、机制、井型、地区和竞争格局划分,2020-2030年预测