


 |
市场调查报告书
商品编码
1755349
马匹医疗保健市场机会、成长动力、产业趋势分析及 2025 - 2034 年预测Equine Healthcare Market Opportunity, Growth Drivers, Industry Trend Analysis, and Forecast 2025 - 2034 |
||||||
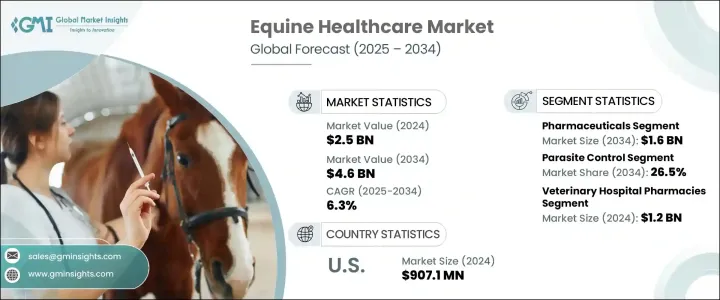
2024年,全球马匹医疗保健市场规模达25亿美元,预计到2034年将以6.3%的复合年增长率成长,达到46亿美元。该市场的扩张主要归因于动物医疗保健支出的增加,以及马主、饲养员和兽医对预防性护理和早期诊断的日益重视。这种意识的增强显着增加了对马匹医疗保健产品和服务的需求。肌肉骨骼疾病和马匹传染病的增加也推动了先进诊断和治疗方法的采用。
此外,市场受益于对创新疗法(例如再生药物、标靶疗法和数位健康监测工具)开发的持续关注。马术运动和赛马领域的投资不断增长也推动了需求成长。随着马匹相关疾病发生率的上升,对更有效、更方便的治疗方案的需求也日益增长。兽医基础设施的加强以及製药公司对专有马用药物的持续投资,也在加速成长中发挥关键作用。马匹领域宠物人性化的趋势进一步促进了技术进步,并持续推动了对专为马匹量身定制的现代医疗保健解决方案的需求。
| 市场范围 | |
|---|---|
| 起始年份 | 2024 |
| 预测年份 | 2025-2034 |
| 起始值 | 25亿美元 |
| 预测值 | 46亿美元 |
| 复合年增长率 | 6.3% |
马匹医疗保健是指透过预防、诊断和治疗各种疾病来维持和改善马匹健康的整体方法。市场涵盖由兽医、製药公司和专业马匹诊所提供的各种医疗和诊断服务。这些解决方案确保用于育种、娱乐和运动的马匹的整体健康和最佳表现。
就产品类别而言,全球马匹保健市场细分为疫苗、药品、诊断试剂、药用饲料添加剂等。其中,药品领域在2024年占据市场主导地位,营收份额达8.179亿美元,预计到2034年将达到16亿美元,复合年增长率为6.6%。此领域产品包括抗感染药、杀寄生虫药、消炎药、止痛药和其他药物治疗。这个领域占据主导地位的原因是,针对呼吸道疾病、肌肉骨骼疾病和传染病等常见马匹疾病的先进疗法的需求不断增长。此外,休閒骑马和竞技赛事的参与度不断提高,凸显了对卓越健康管理方案的需求。
依适应症划分,市场分为寄生虫控制、肌肉骨骼疾病、马流感、马脑脊髓炎、马疱疹、西尼罗河病毒、破伤风等。寄生虫控制细分市场在 2024 年占据了 25.1% 的市场份额,预计到 2034 年将达到 26.5%。由于人们普遍需要控制危害马匹健康和运动表现的有害寄生虫,这一细分市场将继续发挥关键作用。体内和体外寄生虫会引发胃肠不适、皮毛退化和体重问题。马匹饲养员和兽医对预防性寄生虫管理的认识不断提高,这推动了对驱虫药和其他控制措施的需求。气候变迁和全年均可进入牧场增加了人们接触寄生虫的机会,从而增加了对创新有效疗法的需求。
按配销通路划分,市场细分为兽医院药房、电商和其他管道。 2024年,兽医院药局占据市场主导地位,估值达12亿美元,预计2034年仍将维持领先地位,复合年增长率达6.7%。这些药房因其全面的服务而备受青睐,包括专业咨询、治疗以及种类繁多的马用药物。其综合的诊疗方法使其成为马主获取马匹资讯的关键管道。
从区域来看,北美地区预计在预测期内的复合年增长率为 6.1%。该地区蓬勃发展的马业、对动物福利的高度重视以及先进的兽医基础设施,使其成为马匹医疗保健领域的领导者。庞大的马匹数量和马匹活动的广泛参与进一步支撑了该地区对专业医疗保健服务的需求。
塑造全球马匹保健市场的关键参与者包括赫斯卡公司 (Heska Corporation)、香奈儿製药 (Chanelle Pharma)、诗华製药 (Ceva)、硕腾 (Zoetis)、百胜 (Esaote)、奥特奇 (Alltech)、Vetoquinol、嘉吉 (Cargill)、德克本药 (Dechra Pharmaceuticals)、爱德金托(Equal Pharma)、默克 (Merck)、Hallmarq Veterinary、勃林格殷格翰 (Boehringer Ingelheim) 和英泰辛 (Intacin)。这些公司积极参与产品创新、策略合作,并不断扩展其产品组合,以满足马匹产业不断变化的需求。
目录
第一章:方法论与范围
第二章:执行摘要
第三章:行业洞察
- 产业生态系统分析
- 产业衝击力
- 成长动力
- 日益壮大的马术运动与休閒活动
- 兽医学技术进步
- 政府和公共组织对动物照护的支持不断增加
- 产业陷阱与挑战
- 缺乏熟练的兽医专业人员
- 成长动力
- 成长潜力分析
- 技术格局
- 製药业的管道分析
- 监管格局
- 未来市场趋势
- 差距分析
- 波特的分析
- PESTEL分析
第四章:竞争格局
- 介绍
- 公司矩阵分析
- 主要市场参与者的竞争分析
- 竞争定位矩阵
- 策略仪表板
第五章:市场估计与预测:按产品,2021 年至 2034 年
- 主要趋势
- 疫苗
- 製药
- 杀寄生虫剂
- 抗感染
- 抗发炎镇痛药
- 其他医药产品
- 药用饲料添加剂
- 诊断
- 其他产品
第六章:市场估计与预测:按适应症,2021 年至 2034 年
- 主要趋势
- 肌肉骨骼疾病
- 寄生虫控制
- 马疱疹
- 马脑脊髓炎
- 马流感
- 破伤风
- 西尼罗病毒
- 其他适应症
第七章:市场估计与预测:按配销通路,2021 年至 2034 年
- 主要趋势
- 兽医院药房
- 电子商务
- 其他分销管道
第八章:市场估计与预测:按地区,2021 年至 2034 年
- 主要趋势
- 北美洲
- 我们
- 加拿大
- 欧洲
- 德国
- 英国
- 法国
- 西班牙
- 义大利
- 荷兰
- 亚太地区
- 中国
- 印度
- 日本
- 澳洲
- 韩国
- 拉丁美洲
- 巴西
- 墨西哥
- 阿根廷
- 中东和非洲
- 南非
- 沙乌地阿拉伯
- 阿联酋
第九章:公司简介
- Alltech
- Bentoii
- Boehringer Ingelheim
- Cargill
- Ceva
- Chanelle Pharma
- Dechra Pharmaceuticals
- Equal pharma
- Esaote
- Hallmarq Veterinary
- Heska Corporation
- IDEXX Laboratories
- Intacin
- Merck
- Vetoquinol
- Zoetis
The Global Equine Healthcare Market was valued at USD 2.5 billion in 2024 and is estimated to grow at a CAGR of 6.3% to reach USD 4.6 billion by 2034. The expansion of this market is primarily attributed to rising animal healthcare spending and an increasing emphasis on preventive care and early diagnosis among horse owners, breeders, and veterinarians. This heightened awareness has significantly increased the demand for equine healthcare products and services. The rise in musculoskeletal disorders and equine infectious diseases has also driven the adoption of advanced diagnostics and treatments.
Furthermore, the market is benefiting from a continuous focus on developing innovative therapeutics such as regenerative medicines, targeted therapies, and digital health monitoring tools. Demand is also being propelled by growing investments in the equine sports and racing sectors. As the occurrence of equine-related diseases increases, so does the need for more effective and accessible treatment options. The strengthening of veterinary infrastructure and rising investments from pharmaceutical companies in proprietary equine medications are also playing a critical role in accelerating growth. The trend of pet humanization within the equine segment is further contributing to technological advancements and sustained demand for modern healthcare solutions tailored for horses.
| Market Scope | |
|---|---|
| Start Year | 2024 |
| Forecast Year | 2025-2034 |
| Start Value | $2.5 Billion |
| Forecast Value | $4.6 Billion |
| CAGR | 6.3% |
Equine healthcare refers to the holistic approach to maintaining and improving horse health through prevention, diagnosis, and treatment of various conditions. The market covers a wide range of medical and diagnostic offerings delivered by veterinarians, pharmaceutical firms, and dedicated equine clinics. These solutions ensure the overall wellness and peak performance of horses used in breeding, recreation, and sports.
In terms of product categories, the global equine healthcare market is segmented into vaccines, pharmaceuticals, diagnostics, medicinal feed additives, and others. Among these, the pharmaceuticals segment led the market in 2024 with a revenue share of USD 817.9 million and is expected to reach USD 1.6 billion by 2034, growing at a CAGR of 6.6%. This segment includes products such as anti-infectives, parasiticides, anti-inflammatories, analgesics, and other pharmaceutical treatments. The segment's dominance is driven by rising demand for advanced therapies targeting common equine conditions like respiratory, musculoskeletal, and infectious diseases. Moreover, the increased involvement in recreational riding and competitive events underscores the need for superior health management protocols.
The market by indication is categorized into parasite control, musculoskeletal disorders, equine influenza, equine encephalomyelitis, equine herpes, West Nile virus, tetanus, and others. The parasite control segment captured a 25.1% market share in 2024 and is forecasted to reach 26.5% by 2034. This segment continues to play a pivotal role due to the widespread need to manage harmful parasites that compromise a horse's health and performance. Internal and external parasites can trigger gastrointestinal distress, coat degradation, and weight issues. Rising awareness among horse caretakers and veterinarians around preventive parasite management is pushing the demand for anthelmintics and other control measures. Changing climatic patterns and year-round access to pasturelands have amplified exposure to parasites, boosting the need for innovative and effective therapeutics.
By distribution channel, the market is segmented into veterinary hospital pharmacies, e-commerce, and others. Veterinary hospital pharmacies dominated the market in 2024 with a valuation of USD 1.2 billion and are projected to maintain their lead through 2034, growing at a CAGR of 6.7%. These pharmacies are preferred due to their comprehensive services, which include professional consultation, treatment, and access to a wide variety of equine medications. Their integrated approach to diagnosis and therapy continues to make them a critical access point for horse owners.
Regionally, North America is projected to grow at a CAGR of 6.1% over the forecast period. The region's robust equine industry, heightened focus on animal welfare, and advanced veterinary infrastructure have positioned it as a leader in the equine healthcare space. A large horse population and widespread participation in equine activities further support the demand for specialized healthcare offerings across the region.
Key players shaping the global equine healthcare market include Heska Corporation, Chanelle Pharma, Ceva, Zoetis, Esaote, Alltech, Vetoquinol, Cargill, Dechra Pharmaceuticals, IDEXX Laboratories, Bentoii, Equal Pharma, Merck, Hallmarq Veterinary, Boehringer Ingelheim, and Intacin. These companies are actively involved in product innovation, strategic collaborations, and expanding their product portfolios to meet the evolving needs of the equine industry.
Table of Contents
Chapter 1 Methodology and Scope
- 1.1 Market scope and definition
- 1.2 Research design
- 1.2.1 Research approach
- 1.2.2 Data collection methods
- 1.3 Base estimates and calculations
- 1.3.1 Base year calculation
- 1.3.2 Key trends for market estimation
- 1.4 Forecast model
- 1.5 Primary research and validation
- 1.5.1 Primary sources
- 1.5.2 Data mining sources
Chapter 2 Executive Summary
- 2.1 Industry 360° synopsis
Chapter 3 Industry Insights
- 3.1 Industry ecosystem analysis
- 3.2 Industry impact forces
- 3.2.1 Growth drivers
- 3.2.1.1 Growing equine sports and recreational activities
- 3.2.1.2 Technological advancements in veterinary medicine
- 3.2.1.3 Increasing support offered by government and public organizations for animal care
- 3.2.2 Industry pitfalls and challenges
- 3.2.2.1 Lack of skilled veterinary professionals
- 3.2.1 Growth drivers
- 3.3 Growth potential analysis
- 3.4 Technology landscape
- 3.5 Pipeline analysis, by pharmaceuticals
- 3.6 Regulatory landscape
- 3.7 Future market trends
- 3.8 Gap Analysis
- 3.9 Porter's analysis
- 3.10 PESTEL analysis
Chapter 4 Competitive Landscape, 2024
- 4.1 Introduction
- 4.2 Company matrix analysis
- 4.3 Competitive analysis of major market players
- 4.4 Competitive positioning matrix
- 4.5 Strategy dashboard
Chapter 5 Market Estimates and Forecast, By Product, 2021 – 2034 ($ Mn)
- 5.1 Key trends
- 5.2 Vaccines
- 5.3 Pharmaceuticals
- 5.3.1 Parasiticides
- 5.3.2 Anti-infective
- 5.3.3 Anti-inflammatory and analgesics
- 5.3.4 Other pharmaceutical products
- 5.4 Medicinal feed additives
- 5.5 Diagnostics
- 5.6 Other products
Chapter 6 Market Estimates and Forecast, By Indication, 2021 – 2034 ($ Mn)
- 6.1 Key trends
- 6.2 Musculoskeletal disorders
- 6.3 Parasite control
- 6.4 Equine herpes
- 6.5 Equine encephalomyelitis
- 6.6 Equine influenza
- 6.7 Tetanus
- 6.8 West Nile Virus
- 6.9 Other indications
Chapter 7 Market Estimates and Forecast, By Distribution Channel, 2021 – 2034 ($ Mn)
- 7.1 Key trends
- 7.2 Veterinary hospital pharmacies
- 7.3 E-commerce
- 7.4 Other distribution channels
Chapter 8 Market Estimates and Forecast, By Region, 2021 – 2034 ($ Mn)
- 8.1 Key trends
- 8.2 North America
- 8.2.1 U.S.
- 8.2.2 Canada
- 8.3 Europe
- 8.3.1 Germany
- 8.3.2 UK
- 8.3.3 France
- 8.3.4 Spain
- 8.3.5 Italy
- 8.3.6 Netherlands
- 8.4 Asia Pacific
- 8.4.1 China
- 8.4.2 India
- 8.4.3 Japan
- 8.4.4 Australia
- 8.4.5 South Korea
- 8.5 Latin America
- 8.5.1 Brazil
- 8.5.2 Mexico
- 8.5.3 Argentina
- 8.6 Middle East and Africa
- 8.6.1 South Africa
- 8.6.2 Saudi Arabia
- 8.6.3 UAE
Chapter 9 Company Profiles
- 9.1 Alltech
- 9.2 Bentoii
- 9.3 Boehringer Ingelheim
- 9.4 Cargill
- 9.5 Ceva
- 9.6 Chanelle Pharma
- 9.7 Dechra Pharmaceuticals
- 9.8 Equal pharma
- 9.9 Esaote
- 9.10 Hallmarq Veterinary
- 9.11 Heska Corporation
- 9.12 IDEXX Laboratories
- 9.13 Intacin
- 9.14 Merck
- 9.15 Vetoquinol
- 9.16 Zoetis
 马匹保健市场分析及预测(至2035年):按类型、产品、服务、技术、应用、最终用户、形式、材质、设备和解决方案划分
 马匹保健市场:依产品、适应症、用途、配销通路、国家及地区划分-全球产业分析、市场规模、市场占有率及2025-2032年预测
 马匹健康市场规模、占有率、成长及全球产业分析:按类型、应用和地区划分的洞察与预测(2025-2034)
 马匹保健市场按产品类型、最终用户、疾病和给药途径划分-2025-2032年全球预测
 马匹医疗保健市场规模、份额和趋势分析报告:按产品、适应症、活动、分销管道、地区和细分市场预测,2025 年至 2033 年
 马匹医疗保健市场 - 全球产业规模、份额、趋势、机会和预测,按产品、适应症、活动、配销通路、地区和竞争细分,2020-2030 年
 2025 年至 2033 年马匹保健市场(按产品、适应症、配销通路和地区划分)
 马匹医疗保健市场规模、份额和成长分析(按产品类型、疾病类型、分销管道、最终用户和地区)- 产业预测 2025-2032
 到 2030 年马医疗保健市场预测:按产品类型、动物类型、疾病类型、分销管道、最终用户和地区进行的全球分析
 马的医疗保健市场,规模,占有率,趋势,产业分析报告:各产品,各适应症,活动,各流通管道,各地区 - 市场预测,2024年~2032年