


 |
市场调查报告书
商品编码
1685114
BEV 车用充电器市场机会、成长动力、产业趋势分析及 2025 - 2034 年预测BEV On-Board Charger Market Opportunity, Growth Drivers, Industry Trend Analysis, and Forecast 2025 - 2034 |
||||||
2024 年全球 BEV 车用充电器市场规模达到 197 亿美元,预计 2025 年至 2034 年期间复合年增长率将达到 20.1%。全球范围内电动车 (EV) 的兴起,加上人们日益转向永续能源解决方案,推动了这项需求激增。随着消费者越来越接受电动车,迫切需要更快、更有效率的充电系统。这种不断发展的情况鼓励製造商进行创新,生产具有更高功率额定值的车载充电器,从而大大缩短充电时间并提高用户满意度。清洁能源技术的加速转变使电动车成为具有环保意识的驾驶员的首选,这反过来又加速了对提供便利并减少等待时间的先进充电基础设施和车载充电器技术的需求。
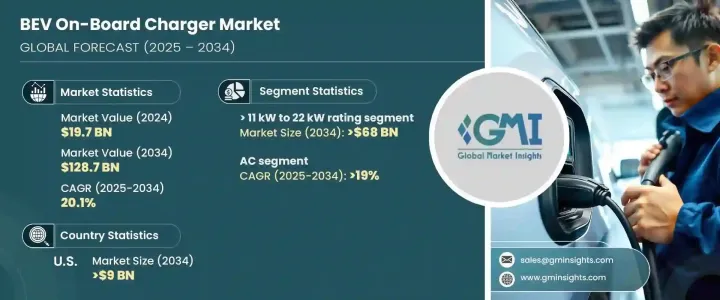
在市场的关键细分市场中,额定功率从 11 kW 到 22 kW 的 BEV 车载充电器预计到 2034 年将产生 680 亿美元的收入。随着电动车车主对更快的充电解决方案的需求,预计该细分市场将快速成长。製造商正在透过开发提供更高功率输出的充电器来应对这项挑战,使车辆能够更快地充电,并满足寻求高效、无忧充电体验的消费者日益增长的需求。这种向高功率充电系统的转变符合电动车采用和充电基础设施扩张的全球趋势,确保了纯电动车市场保持上升趋势。
| 市场范围 | |
|---|---|
| 起始年份 | 2024 |
| 预测年份 | 2025-2034 |
| 起始值 | 197亿美元 |
| 预测值 | 1287亿美元 |
| 复合年增长率 | 20.1% |
另一个重要趋势是交流电 (AC) 电动车车载充电器的兴起,预计到 2034 年其复合年增长率将达到 19%。住宅区和商业区电动车充电基础设施的不断发展支持了这一成长。交流充电器具有成本效益,其广泛普及为希望在家中或公共充电站为电动车充电的消费者提高了便利性。随着对公共和私人充电网路扩展的大量投资,对交流车载充电器的需求正在稳步增长,促进了市场的整体成长。
预计到 2034 年,美国电动车车载充电器市场规模将达到 90 亿美元。美国电动车的普及率不断提高,对更快、更有效率的充电解决方案的需求也日益增长,这些因素正在推动这个市场向前发展。製造商正专注于生产 11 kW 至 22 kW 范围内的充电器,以满足消费者对更快充电时间的期望。标准化充电协议的努力也在进行中,旨在使充电过程更加无缝,并增强不同电动车型号和充电器之间的互通性。在政府利好政策的支持下,充电基础设施的扩张将进一步推动美国市场及其成长潜力。
目录
第 1 章:方法论与范围
- 市场范围和定义
- 市场估计和预测参数
- 预测计算
- 资料来源
- 基本的
- 次要
- 有薪资的
- 民众
第 2 章:执行摘要
第 3 章:产业洞察
- 产业生态系统分析
- 监管格局
- 产业衝击力
- 成长动力
- 产业陷阱与挑战
- 成长潜力分析
- 波特的分析
- PESTEL 分析
第四章:竞争格局
- 介绍
- 战略展望
- 创新与永续发展格局
第 5 章:市场规模及预测:依评级,2021 – 2034 年
- 主要趋势
- < 11 千瓦
- > 11 千瓦至 22 千瓦
- > 22 千瓦
第六章:市场规模及预测:依目前,2021 – 2034 年
- 主要趋势
- 交流
- 直流
第 7 章:市场规模及预测:按地区,2021 – 2034 年
- 主要趋势
- 北美洲
- 我们
- 加拿大
- 墨西哥
- 欧洲
- 挪威
- 德国
- 法国
- 荷兰
- 英国
- 瑞典
- 亚太地区
- 中国
- 日本
- 印度
- 韩国
- 澳洲
- 中东和非洲
- 沙乌地阿拉伯
- 阿联酋
- 南非
- 拉丁美洲
- 巴西
- 阿根廷
第八章:公司简介
- Bel Fuse
- BorgWarner
- Brusa Elektronik
- Delta Energy Systems
- Eaton
- Ficosa Internacional
- Hyundai Motor
- Infineon Technologies
- Innolectric
- Nissan Motor
- Phinia
- Stercom Power Solutions
- STMicroelectronics
- Tesla
- Toyota Industries
- Valeo
- Xepics Italia
The Global BEV On-Board Charger Market reached USD 19.7 billion in 2024 and is expected to expand at an exceptional CAGR of 20.1% from 2025 to 2034. The rise of electric vehicles (EVs) worldwide, coupled with the growing shift towards sustainable energy solutions, is driving this surge in demand. As consumers increasingly embrace electric mobility, there is an urgent need for faster and more efficient charging systems. This evolving landscape is encouraging manufacturers to innovate and produce on-board chargers with higher power ratings, reducing charging times significantly and enhancing user satisfaction. The accelerated shift to clean energy technologies is making EVs a preferred choice for eco-conscious drivers, which, in turn, accelerates the need for advanced charging infrastructure and on-board charger technologies that deliver convenience and reduced waiting times.
Among the key segments of the market, the BEV on-board chargers with power ratings ranging from 11 kW to 22 kW are projected to generate USD 68 billion by 2034. As electric vehicle owners demand quicker charging solutions, this segment is expected to grow rapidly. Manufacturers are responding by developing chargers that offer higher power outputs, allowing vehicles to charge faster and meet the growing needs of consumers who seek efficient, hassle-free charging experiences. This shift towards high-power charging systems aligns with global trends in EV adoption and charging infrastructure expansion, ensuring that the BEV market remains on an upward trajectory.
| Market Scope | |
|---|---|
| Start Year | 2024 |
| Forecast Year | 2025-2034 |
| Start Value | $19.7 Billion |
| Forecast Value | $128.7 Billion |
| CAGR | 20.1% |
Another significant trend is the rise of AC (alternating current) EV on-board chargers, which are anticipated to experience a CAGR of 19% through 2034. The increasing development of EV charging infrastructure in both residential and commercial areas is supporting this growth. AC chargers are cost-effective, and their widespread availability is enhancing accessibility for consumers looking to charge their electric vehicles at home or public charging stations. With significant investments being made in the expansion of both public and private charging networks, the demand for AC on-board chargers is steadily increasing, contributing to the market's overall growth.
The U.S. market for BEV on-board chargers is expected to generate USD 9 billion by 2034. The country's increasing adoption of electric vehicles, along with a growing demand for faster and more efficient charging solutions, is driving this market forward. Manufacturers are focusing on producing chargers within the 11 kW to 22 kW range to meet consumer expectations for quicker charge times. Efforts to standardize charging protocols are also underway, aiming to make the charging process more seamless and enhance interoperability between different EV models and chargers. The expansion of charging infrastructure, supported by favorable government policies, is further boosting the U.S. market and its growth potential.
Table of Contents
Chapter 1 Methodology & Scope
- 1.1 Market scope & definitions
- 1.2 Market estimates & forecast parameters
- 1.3 Forecast calculation
- 1.4 Data sources
- 1.4.1 Primary
- 1.4.2 Secondary
- 1.4.2.1 Paid
- 1.4.2.2 Public
Chapter 2 Executive Summary
- 2.1 Industry synopsis, 2021 - 2034
Chapter 3 Industry Insights
- 3.1 Industry ecosystem analysis
- 3.2 Regulatory landscape
- 3.3 Industry impact forces
- 3.3.1 Growth drivers
- 3.3.2 Industry pitfalls & challenges
- 3.4 Growth potential analysis
- 3.5 Porter's analysis
- 3.5.1 Bargaining power of suppliers
- 3.5.2 Bargaining power of buyers
- 3.5.3 Threat of new entrants
- 3.5.4 Threat of substitutes
- 3.6 PESTEL analysis
Chapter 4 Competitive Landscape, 2024
- 4.1 Introduction
- 4.2 Strategic outlook
- 4.3 Innovation & sustainability landscape
Chapter 5 Market Size and Forecast, By Rating, 2021 – 2034 (Units, USD Billion)
- 5.1 Key trends
- 5.2 < 11 kW
- 5.3 > 11 kW to 22 kW
- 5.4 > 22 kW
Chapter 6 Market Size and Forecast, By Current, 2021 – 2034 (Units, USD Billion)
- 6.1 Key trends
- 6.2 AC
- 6.3 DC
Chapter 7 Market Size and Forecast, By Region, 2021 – 2034 (Units, USD Billion)
- 7.1 Key trends
- 7.2 North America
- 7.2.1 U.S.
- 7.2.2 Canada
- 7.2.3 Mexico
- 7.3 Europe
- 7.3.1 Norway
- 7.3.2 Germany
- 7.3.3 France
- 7.3.4 Netherlands
- 7.3.5 UK
- 7.3.6 Sweden
- 7.4 Asia Pacific
- 7.4.1 China
- 7.4.2 Japan
- 7.4.3 India
- 7.4.4 South Korea
- 7.4.5 Australia
- 7.5 Middle East & Africa
- 7.5.1 Saudi Arabia
- 7.5.2 UAE
- 7.5.3 South Africa
- 7.6 Latin America
- 7.6.1 Brazil
- 7.6.2 Argentina
Chapter 8 Company Profiles
- 8.1 Bel Fuse
- 8.2 BorgWarner
- 8.3 Brusa Elektronik
- 8.4 Delta Energy Systems
- 8.5 Eaton
- 8.6 Ficosa Internacional
- 8.7 Hyundai Motor
- 8.8 Infineon Technologies
- 8.9 Innolectric
- 8.10 Nissan Motor
- 8.11 Phinia
- 8.12 Stercom Power Solutions
- 8.13 STMicroelectronics
- 8.14 Tesla
- 8.15 Toyota Industries
- 8.16 Valeo
- 8.17 Xepics Italia
 全球电动车车载充电器市场:依动力类型、车辆类型、输出功率、国家及地区划分-产业分析、市场规模、份额及2025年至2032年未来预测
 交流电动车车载充电器市场分析及预测(至2035年):依类型、产品类型、技术、组件、应用、安装类型、最终用户、功能、设备及解决方案划分
 车载充电器:市场份额分析、行业趋势和统计数据、成长预测(2026-2031 年)
 车载充电器市场规模、份额、趋势和预测(按功率输出、车辆类型、动力方式、分销管道和地区划分),2026-2034年
 2026年全球车用充电器市场报告双向汽车电池充电器市场报告(2026 年)
 电动车车用充电器市场-全球产业规模、份额、趋势、机会与预测:按动力类型、车辆类型、分销管道、设计类型、产品类型、地区和竞争格局划分,2021-2031年
 电动汽车车载充电器:全球市场份额和排名、总收入和需求预测(2025-2031 年)
 全球双向充电市场(至2035年):按应用(V2G、V2H、V2L)、动力类型(纯电动车、插电式混合动力车)、车辆类型(乘用车、轻型商用车)、充电型(交流电充电、直流充电)、最终用户和地区划分
 2032 年车用充电器市场预测:按车辆类型、推进类型、充电器类型、输出功率、最终用户和地区进行的全球分析