


 |
市场调查报告书
商品编码
1666608
替代燃料汽车 (AFV) 市场机会、成长动力、产业趋势分析和 2025 - 2034 年预测Alternative Fuel Vehicles (AFV) Market Opportunity, Growth Drivers, Industry Trend Analysis, and Forecast 2025 - 2034 |
||||||
2024 年全球替代燃料汽车市场价值为 7,962 亿美元,预计 2025 年至 2034 年期间的复合年增长率为 14%。世界各国政府正在推出旨在减少碳排放并鼓励绿色替代品转变的政策。
除了这些政府措施之外,电动车(EV)电池的技术突破和不断扩大的充电基础设施也让消费者更容易转向电动车。消费者对传统燃油汽车对环境影响的认识不断提高,这也推动了市场的成长,促使汽车製造商大力投资开发环保解决方案。随着世界继续努力应对气候变迁和环境恶化,替代燃料汽车被视为解决方案的重要组成部分。
| 市场范围 | |
|---|---|
| 起始年份 | 2024 |
| 预测年份 | 2025-2034 |
| 起始值 | 7962亿美元 |
| 预测值 | 3.1兆美元 |
| 复合年增长率 | 14% |
为了满足全球碳排放的需要,人们越来越重视减少对化石燃料的依赖,从而导致对电动车(EV)的大量投资。政府补贴、税收减免和对电动车基础设施的支持使得电动车对消费者的吸引力越来越大。电池系统技术的快速进步进一步推动了对电动车的需求,提高了行驶里程和充电速度,从而提高了汽车的整体便利性。随着越来越多充电网路的建立,里程焦虑(电动车普及的一大障碍)正在稳定减少。随着电动车变得越来越普及且价格越来越便宜,其受欢迎程度必将飙升,为整个市场的扩张做出重大贡献。
市场按燃料类型细分为电动车、生质燃料和其他替代燃料。光是电动车领域在 2024 年就创造了 6,000 亿美元的收入,预计未来几年将经历大幅成长。推动这一增长的因素包括环保意识的增强、电池技术的改进以及进一步鼓励消费者选择电动车的政府激励措施。汽车製造商也透过多样化产品线来满足这一需求,这将进一步推动市场扩张。
就车辆类型而言,市场分为乘用车和商用车。预计 2025 年至 2034 年期间乘用车市场的复合年增长率为 13%。预计电动和混合动力汽车技术都将在政府倡议和电动车充电基础设施发展的推动下取得进步,这将使这些汽车更具吸引力。
2024年,欧洲将占据全球替代燃料汽车市场份额的45%,这在很大程度上归功于该地区雄心勃勃的碳中和目标以及消费者对永续性的日益关注。欧洲各国政府正透过财政激励、补助金和投资充电网路等方式支持电动车的普及,克服里程焦虑等障碍,促进电动车的广泛普及。
目录
第 1 章:方法论与范围
- 研究设计
- 研究方法
- 资料收集方法
- 基础估算与计算
- 基准年计算
- 市场估计的主要趋势
- 预测模型
- 初步研究和验证
- 主要来源
- 资料探勘来源
- 市场范围和定义
第 2 章:执行摘要
第 3 章:产业洞察
- 产业生态系统分析
- 供应商概况
- 技术提供者
- 服务提供者
- 製造商
- 经销商
- 最终用途
- 利润率分析
- 技术与创新格局
- 专利分析
- 监管格局
- 成本分析
- 案例研究
- 衝击力
- 成长动力
- 全球燃料价格上涨
- 在全球扩大充电基础设施
- 越来越重视电池的成本效率
- 政府激励措施和监管力道加大
- 产业陷阱与挑战
- 前期成本高
- 充电基础设施有限
- 成长动力
- 成长潜力分析
- 波特的分析
- PESTEL 分析
第四章:竞争格局
- 介绍
- 公司市占率分析
- 竞争定位矩阵
- 战略展望矩阵
第五章:市场估计与预测:按燃料,2021 - 2034 年
- 主要趋势
- 电的
- 纯电动车 (BEV)
- 混合动力电动车 (HEV)
- 插电式混合动力车 (PHEV)
- 燃料电池电动车 (FCEV)
- 生物燃料
- 其他的
第六章:市场估计与预测:依车型,2021 - 2034 年
- 主要趋势
- 搭乘用车
- 掀背车
- 轿车
- 越野车
- 商用车
- 轻型商用车 (LCV)
- 重型商用车 (HCV)
第 7 章:市场估计与预测:按最终用途,2021 - 2034 年
- 主要趋势
- 商业和机队
- 大众运输
- 政府及市政
- 其他的
第 8 章:市场估计与预测:按地区,2021 - 2034 年
- 主要趋势
- 北美洲
- 我们
- 加拿大
- 欧洲
- 英国
- 德国
- 法国
- 义大利
- 西班牙
- 俄罗斯
- 北欧
- 亚太地区
- 中国
- 印度
- 日本
- 澳洲
- 韩国
- 东南亚
- 拉丁美洲
- 巴西
- 墨西哥
- 阿根廷
- 中东及非洲
- 阿联酋
- 南非
- 沙乌地阿拉伯
第九章:公司简介
- Audi
- BMW
- BYD Company
- Faraday Future
- Fiat Chrysler Automobiles
- Fisker
- Ford Motor
- General Motors
- Honda Motors
- Hyundai Motor
- Kia
- Lucid Motors
- Mercedes-Benz
- Nissan Motor
- Polestar Automotive H
- Rivian Automotive
- Tesla
- Toyota Motor
- Volkswagen
- Volvo
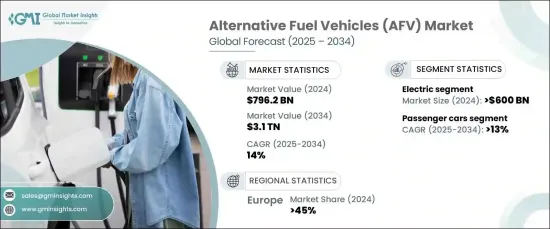
The Global Alternative Fuel Vehicles Market was valued at USD 796.2 billion in 2024 and is projected to expand at a CAGR of 14% between 2025 and 2034. This robust growth is primarily fueled by the increasing demand for sustainable transportation solutions, a shift towards cleaner mobility, and rising concerns over environmental sustainability. Governments across the globe are rolling out policies designed to reduce carbon emissions and encourage the transition to green alternatives.
Along with these government initiatives, technological breakthroughs in electric vehicle (EV) batteries and expanding charging infrastructure are making it easier for consumers to switch to electric options. The market growth is also being propelled by greater consumer awareness about the environmental impact of traditional fuel-driven vehicles, pushing automakers to invest heavily in the development of eco-friendly solutions. As the world continues to grapple with climate change and environmental degradation, alternative fuel vehicles are seen as an essential part of the solution.
| Market Scope | |
|---|---|
| Start Year | 2024 |
| Forecast Year | 2025-2034 |
| Start Value | $796.2 Billion |
| Forecast Value | $3.1 Trillion |
| CAGR | 14% |
The increasing focus on reducing dependence on fossil fuels, in line with the need to curb global carbon emissions, has led to substantial investments in electric vehicles (EVs). Government subsidies, tax breaks, and support for EV infrastructure are making electric mobility increasingly attractive to consumers. The demand for EVs is further fueled by rapid technological advancements in battery systems, enhancing driving ranges and charging speeds, which contribute to the vehicles' overall convenience. With more extensive charging networks in place, range anxiety, a significant barrier to EV adoption, is steadily diminishing. As electric vehicles become more accessible and affordable, their popularity is set to soar, contributing significantly to the overall market expansion.
The market is segmented by fuel type into electric vehicles, biofuels, and other alternative fuels. The electric vehicle segment alone generated USD 600 billion in 2024, and it is expected to experience substantial growth in the coming years. Factors driving this surge include heightened environmental awareness, improvements in battery technology, and government incentives that further encourage consumers to opt for electric cars. Automakers are also responding to this demand by diversifying their product lines, which will further fuel market expansion.
In terms of vehicle types, the market is divided into passenger cars and commercial vehicles. The passenger car segment is anticipated to experience a CAGR of 13% from 2025 to 2034. The surge in demand for eco-friendly transportation options is primarily driven by consumer preferences shifting toward cleaner, more energy-efficient vehicles. Both electric and hybrid vehicle technologies are expected to witness advancements spurred on by government initiatives and the growth of EV charging infrastructure, which together make these vehicles even more appealing.
In 2024, Europe accounted for 45% of the global market share in alternative fuel vehicles, largely due to the region's ambitious carbon neutrality targets and increased consumer focus on sustainability. European governments are supporting EV adoption through financial incentives, grants, and investment in charging networks, overcoming barriers like range anxiety and contributing to the widespread adoption of electric vehicles.
Table of Contents
Chapter 1 Methodology & Scope
- 1.1 Research design
- 1.1.1 Research approach
- 1.1.2 Data collection methods
- 1.2 Base estimates & calculations
- 1.2.1 Base year calculation
- 1.2.2 Key trends for market estimation
- 1.3 Forecast model
- 1.4 Primary research and validation
- 1.4.1 Primary sources
- 1.4.2 Data mining sources
- 1.5 Market scope & definition
Chapter 2 Executive Summary
- 2.1 Industry 3600 synopsis, 2021 - 2034
Chapter 3 Industry Insights
- 3.1 Industry ecosystem analysis
- 3.2 Supplier landscape
- 3.2.1 Technology providers
- 3.2.2 Service providers
- 3.2.3 Manufacturers
- 3.2.4 Distributors
- 3.2.5 End Use
- 3.3 Profit margin analysis
- 3.4 Technology & innovation landscape
- 3.5 Patent analysis
- 3.6 Regulatory landscape
- 3.7 Cost analysis
- 3.8 Case study
- 3.9 Impact forces
- 3.9.1 Growth drivers
- 3.9.1.1 Increasing fuel prices worldwide
- 3.9.1.2 Expanding charging infrastructure globally
- 3.9.1.3 Rising emphasis on cost-efficient batteries
- 3.9.1.4 Surge in government incentives and regulations
- 3.9.2 Industry pitfalls & challenges
- 3.9.2.1 High upfront costs
- 3.9.2.2 Limited availability of charging infrastructure
- 3.9.1 Growth drivers
- 3.10 Growth potential analysis
- 3.11 Porter’s analysis
- 3.12 PESTEL analysis
Chapter 4 Competitive Landscape, 2024
- 4.1 Introduction
- 4.2 Company market share analysis
- 4.3 Competitive positioning matrix
- 4.4 Strategic outlook matrix
Chapter 5 Market Estimates & Forecast, By Fuel, 2021 - 2034 ($Bn, Units)
- 5.1 Key trends
- 5.2 Electric
- 5.2.1 Battery Electric Vehicle (BEV)
- 5.2.2 Hybrid Electric Vehicle (HEV)
- 5.2.3 Plug-in Hybrid electric Vehicle (PHEV)
- 5.2.4 Fuel Cell Electric Vehicle (FCEV)
- 5.3 Biofuel
- 5.4 Others
Chapter 6 Market Estimates & Forecast, By Vehicle, 2021 - 2034 ($Bn, Units)
- 6.1 Key trends
- 6.2 Passenger vehicles
- 6.2.1 Hatchback
- 6.2.2 Sedan
- 6.2.3 SUV
- 6.3 Commercial vehicles
- 6.3.1 Light Commercial Vehicles (LCV)
- 6.3.2 Heavy Commercial Vehicles (HCV)
Chapter 7 Market Estimates & Forecast, By End Use, 2021 - 2034 ($Bn, Units)
- 7.1 Key trends
- 7.2 Commercial & fleet
- 7.3 Public transportation
- 7.4 Government & municipal
- 7.5 Others
Chapter 8 Market Estimates & Forecast, By Region, 2021 - 2034 ($Bn, Units)
- 8.1 Key trends
- 8.2 North America
- 8.2.1 U.S.
- 8.2.2 Canada
- 8.3 Europe
- 8.3.1 UK
- 8.3.2 Germany
- 8.3.3 France
- 8.3.4 Italy
- 8.3.5 Spain
- 8.3.6 Russia
- 8.3.7 Nordics
- 8.4 Asia Pacific
- 8.4.1 China
- 8.4.2 India
- 8.4.3 Japan
- 8.4.4 Australia
- 8.4.5 South Korea
- 8.4.6 Southeast Asia
- 8.5 Latin America
- 8.5.1 Brazil
- 8.5.2 Mexico
- 8.5.3 Argentina
- 8.6 MEA
- 8.6.1 UAE
- 8.6.2 South Africa
- 8.6.3 Saudi Arabia
Chapter 9 Company Profiles
- 9.1 Audi
- 9.2 BMW
- 9.3 BYD Company
- 9.4 Faraday Future
- 9.5 Fiat Chrysler Automobiles
- 9.6 Fisker
- 9.7 Ford Motor
- 9.8 General Motors
- 9.9 Honda Motors
- 9.10 Hyundai Motor
- 9.11 Kia
- 9.12 Lucid Motors
- 9.13 Mercedes-Benz
- 9.14 Nissan Motor
- 9.15 Polestar Automotive H
- 9.16 Rivian Automotive
- 9.17 Tesla
- 9.18 Toyota Motor
- 9.19 Volkswagen
- 9.20 Volvo
 替代燃料汽车市场-全球产业规模、份额、趋势、机会和预测,按燃料类型、车辆类型、地区和竞争格局划分,2020-2030年预测
 替代燃料汽车(AFV):全球市场份额和排名、总销量和需求预测(2025-2031 年)
 替代燃料汽车市场(按推进类型、里程、车辆类型和最终用途)—2025-2032 年全球预测汽车燃料系统市场(按燃料类型、组件类型、车辆类型和销售管道)——2025-2032 年全球预测
 2025年全球替代燃料汽车市场报告
 2025 年至 2033 年按燃料类型、车辆类型、车辆等级和地区分類的替代燃料和混合动力汽车市场
 替代燃料车的全球市场:产业分析,规模,占有率,成长,趋势,预测(2025年~2032年)
 替代燃料汽车的全球市场:成长,未来展望,竞争分析 (2025年~2033年)
 2024 年至 2031 年替代燃料汽车 (AFV) 市场(按燃料类型、车辆类型和地区划分)