


 |
市场调查报告书
商品编码
1716627
视网膜母细胞瘤治疗市场机会、成长动力、产业趋势分析及 2025 - 2034 年预测Retinoblastoma Treatment Market Opportunity, Growth Drivers, Industry Trend Analysis, and Forecast 2025 - 2034 |
||||||
2024 年全球视网膜母细胞瘤治疗市值为 16 亿美元,预计 2025 年至 2034 年期间的复合年增长率为 5%。这一增长主要得益于视网膜母细胞瘤发病率的上升、标靶治疗的不断进步以及眼科肿瘤学的持续创新。随着这种罕见但严重的眼癌在儿童中的发生率不断上升,对有效治疗策略的需求变得前所未有的迫切。研究机构和製药公司正在积极投资开发能够改善患者治疗效果同时最大限度减少不良影响的新疗法。
世界各国政府和医疗保健组织正在进行宣传活动,促进早期诊断,显着提高存活率。动脉内化疗和玻璃体内化疗等先进治疗方式的出现正在改变视网膜母细胞瘤的治疗模式。基因治疗和精准医疗等新兴技术进一步推动了市场乐观情绪。此外,人工智慧在眼科肿瘤学中的应用正在帮助专家在早期阶段发现视网膜母细胞瘤,从而提高治疗效果。随着各大医院和癌症中心扩大儿科肿瘤科室,获得专门的视网膜母细胞瘤治疗的机会变得越来越普遍,从而推动了市场扩张。
| 市场范围 | |
|---|---|
| 起始年份 | 2024 |
| 预测年份 | 2025-2034 |
| 起始值 | 16亿美元 |
| 预测值 | 26亿美元 |
| 复合年增长率 | 5% |
视网膜母细胞瘤治疗市场分为眼内视网膜母细胞瘤及眼外视网膜母细胞瘤。随着眼内视网膜母细胞瘤发生率的上升以及创新治疗方法的日益普及,预计到 2032 年眼内治疗领域将创造 20 亿美元的产值。人们对玻璃体内和动脉内化疗的日益青睐极大地促进了这一领域的成长,因为与传统化疗相比,这些方法有助于降低全身毒性。患者和医疗保健提供者正在积极寻求能够提高疗效同时最大限度减少长期副作用的治疗方案,这进一步推动了市场需求。
就最终用途而言,医院主导了视网膜母细胞瘤治疗市场,2024 年创造了 6.859 亿美元的收入。随着医院对肿瘤科和专门的儿科眼科部门进行大量投资,由眼科医生、遗传专家和肿瘤学家组成的多学科团队正在合作开发有针对性的治疗方法。医院环境中化疗中心的整合提高了治疗的可近性,使医院成为视网膜母细胞瘤管理的关键参与者。随着医疗机构不断采用尖端技术和治疗方案,医院领域将在未来几年实现持续成长。
2024 年,美国视网膜母细胞瘤治疗市场规模达到 5.255 亿美元,病例数的增加归因于儿童 RB1 基因突变盛行率的增加。美国国家癌症研究所和美国癌症协会正在透过宣传活动积极推动早期检测计划,这加速了对先进治疗方案的需求。美国各地领先的医疗保健提供者正在投资新疗法、临床试验和专门的儿科肿瘤中心,以改善患者的治疗效果。随着精准医疗和标靶治疗方法的不断进步,美国预计将继续在全球视网膜母细胞瘤治疗市场占据主导地位。
目录
第一章:方法论与范围
第二章:执行摘要
第三章:行业洞察
- 产业生态系统分析
- 产业衝击力
- 成长动力
- 视网膜母细胞瘤发生率不断上升
- 视网膜母细胞瘤的早期诊断与治疗
- 产业陷阱与挑战
- 治疗费用高
- 视网膜母细胞瘤治疗的副作用
- 成长动力
- 成长潜力分析
- 监管格局
- 技术格局
- 未来市场趋势
- 差距分析
- 专利分析
- 管道分析
- 波特的分析
- PESTEL分析
第四章:竞争格局
- 介绍
- 公司市占率分析
- 公司矩阵分析
- 主要市场参与者的竞争分析
- 竞争定位矩阵
- 策略仪表板
第五章:市场估计与预测:依疾病类型,2021 年至 2034 年
- 主要趋势
- 非遗传性视网膜母细胞瘤
- 遗传性视网膜母细胞瘤
第六章:市场估计与预测:依疾病阶段,2021 年至 2034 年
- 主要趋势
- 眼内视网膜母细胞瘤
- 眼外视网膜母细胞瘤
第七章:市场估计与预测:依治疗类型,2021 年至 2034 年
- 主要趋势
- 化疗
- 放射治疗
- 手术
- 雷射治疗
- 冷冻疗法
第八章:市场估计与预测:依最终用途,2021 年至 2034 年
- 主要趋势
- 医院
- 癌症治疗中心
- 专科眼科诊所
第九章:市场估计与预测:按地区,2021 年至 2034 年
- 主要趋势
- 北美洲
- 我们
- 加拿大
- 欧洲
- 德国
- 英国
- 法国
- 西班牙
- 义大利
- 荷兰
- 亚太地区
- 中国
- 日本
- 印度
- 澳洲
- 韩国
- 拉丁美洲
- 巴西
- 墨西哥
- 阿根廷
- 中东和非洲
- 南非
- 沙乌地阿拉伯
- 阿联酋
第十章:公司简介
- Advancium Health
- Baxter International
- Bristol-Myers Squibb Company
- Cadila Pharmaceuticals
- Cellceutix Corporation
- GlaxoSmithKline
- Johnson & Johnson
- Merck & Co.
- Novartis
- Pfizer
- Teva Pharmaceutical Industries
- Theriva Biologics
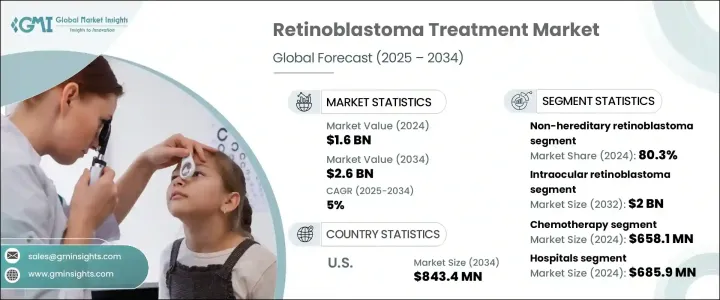
The Global Retinoblastoma Treatment Market was valued at USD 1.6 billion in 2024 and is projected to grow at a CAGR of 5% between 2025 and 2034. This growth is primarily driven by the rising incidence of retinoblastoma, increasing advancements in targeted therapies, and continuous innovations in ocular oncology. With the prevalence of this rare but serious eye cancer rising among children, the need for effective treatment strategies has never been more critical. Research institutions and pharmaceutical companies are aggressively investing in the development of novel therapies that can enhance patient outcomes while minimizing adverse effects.
Governments and healthcare organizations worldwide are launching awareness campaigns to promote early diagnosis, significantly improving survival rates. The availability of advanced treatment modalities, including intra-arterial chemotherapy and intravitreal chemotherapy, is transforming the landscape of retinoblastoma management. Emerging technologies, such as gene therapy and precision medicine, are further driving optimism in the market. Additionally, the integration of artificial intelligence in ocular oncology is helping specialists detect retinoblastoma at earlier stages, improving treatment efficacy. With major hospitals and cancer centers expanding pediatric oncology units, access to specialized retinoblastoma care is becoming more widespread, fueling market expansion.
| Market Scope | |
|---|---|
| Start Year | 2024 |
| Forecast Year | 2025-2034 |
| Start Value | $1.6 Billion |
| Forecast Value | $2.6 Billion |
| CAGR | 5% |
The market for retinoblastoma treatment is segmented into intraocular and extraocular retinoblastoma. The intraocular segment is expected to generate USD 2 billion by 2032, driven by the rising incidence of intraocular retinoblastoma cases and the growing adoption of innovative treatment methods. The increasing preference for intravitreal and intra-arterial chemotherapy is significantly contributing to this segment's growth, as these methods help reduce systemic toxicity compared to traditional chemotherapy. Patients and healthcare providers are actively seeking treatment options that offer improved efficacy while minimizing long-term side effects, which is further propelling market demand.
In terms of end-use, hospitals dominated the retinoblastoma treatment market, generating USD 685.9 million in 2024. With hospitals making significant investments in oncology and specialized pediatric ophthalmology units, multidisciplinary teams comprising ophthalmologists, genetic specialists, and oncologists are collaborating to develop targeted treatment approaches. The integration of chemotherapy centers within hospital settings is enhancing treatment accessibility, positioning hospitals as key players in retinoblastoma management. As medical institutions continue to adopt cutting-edge technologies and treatment protocols, the hospital segment is set to witness sustained growth over the coming years.
U.S. retinoblastoma treatment market generated USD 525.5 million in 2024, with rising cases attributed to the increasing prevalence of RB1 gene mutations among children. The National Cancer Institute and the American Cancer Society are actively promoting early detection initiatives through awareness campaigns, which are accelerating the demand for advanced treatment options. Leading healthcare providers across the U.S. are investing in novel therapies, clinical trials, and specialized pediatric oncology centers to improve patient outcomes. With continued advancements in precision medicine and targeted treatment approaches, the U.S. is expected to remain a dominant player in the global retinoblastoma treatment market.
Table of Contents
Chapter 1 Methodology and Scope
- 1.1 Market scope and definitions
- 1.2 Research design
- 1.2.1 Research approach
- 1.2.2 Data collection methods
- 1.3 Base estimates and calculations
- 1.3.1 Base year calculation
- 1.3.2 Key trends for market estimation
- 1.4 Forecast model
- 1.5 Primary research and validation
- 1.5.1 Primary sources
- 1.5.2 Data mining sources
Chapter 2 Executive Summary
- 2.1 Industry 360° Synopsis
Chapter 3 Industry Insights
- 3.1 Industry ecosystem analysis
- 3.2 Industry impact forces
- 3.2.1 Growth drivers
- 3.2.1.1 Increasing incidence of retinoblastoma
- 3.2.1.2 Early diagnosis and treatment of retinoblastoma
- 3.2.2 Industry pitfalls and challenges
- 3.2.2.1 High treatment cost
- 3.2.2.2 Side effects associated with retinoblastoma treatment
- 3.2.1 Growth drivers
- 3.3 Growth potential analysis
- 3.4 Regulatory landscape
- 3.5 Technological landscape
- 3.6 Future market trends
- 3.7 Gap analysis
- 3.8 Patent analysis
- 3.9 Pipeline analysis
- 3.10 Porter's analysis
- 3.11 PESTEL analysis
Chapter 4 Competitive Landscape, 2024
- 4.1 Introduction
- 4.2 Company market share analysis
- 4.3 Company matrix analysis
- 4.4 Competitive analysis of major market players
- 4.5 Competitive positioning matrix
- 4.6 Strategy dashboard
Chapter 5 Market Estimates and Forecast, By Disease Type, 2021 – 2034 ($ Mn)
- 5.1 Key trends
- 5.2 Non-hereditary retinoblastoma
- 5.3 Hereditary retinoblastoma
Chapter 6 Market Estimates and Forecast, By Disease Stage, 2021 – 2034 ($ Mn)
- 6.1 Key trends
- 6.2 Intraocular retinoblastoma
- 6.3 Extraocular retinoblastoma
Chapter 7 Market Estimates and Forecast, By Treatment Type, 2021 – 2034 ($ Mn)
- 7.1 Key trends
- 7.2 Chemotherapy
- 7.3 Radiation therapy
- 7.4 Surgery
- 7.5 Laser therapy
- 7.6 Cryotherapy
Chapter 8 Market Estimates and Forecast, By End Use, 2021 – 2034 ($ Mn)
- 8.1 Key trends
- 8.2 Hospitals
- 8.3 Cancer treatment center
- 8.4 Specialty eye clinics
Chapter 9 Market Estimates and Forecast, By Region, 2021 – 2034 ($ Mn)
- 9.1 Key trends
- 9.2 North America
- 9.2.1 U.S.
- 9.2.2 Canada
- 9.3 Europe
- 9.3.1 Germany
- 9.3.2 UK
- 9.3.3 France
- 9.3.4 Spain
- 9.3.5 Italy
- 9.3.6 Netherlands
- 9.4 Asia Pacific
- 9.4.1 China
- 9.4.2 Japan
- 9.4.3 India
- 9.4.4 Australia
- 9.4.5 South Korea
- 9.5 Latin America
- 9.5.1 Brazil
- 9.5.2 Mexico
- 9.5.3 Argentina
- 9.6 Middle East and Africa
- 9.6.1 South Africa
- 9.6.2 Saudi Arabia
- 9.6.3 UAE
Chapter 10 Company Profiles
- 10.1 Advancium Health
- 10.2 Baxter International
- 10.3 Bristol-Myers Squibb Company
- 10.4 Cadila Pharmaceuticals
- 10.5 Cellceutix Corporation
- 10.6 GlaxoSmithKline
- 10.7 Johnson & Johnson
- 10.8 Merck & Co.
- 10.9 Novartis
- 10.10 Pfizer
- 10.11 Teva Pharmaceutical Industries
- 10.12 Theriva Biologics
