


 |
市场调查报告书
商品编码
1773259
动力行动装置市场机会、成长动力、产业趋势分析及 2025 - 2034 年预测Powered Mobility Devices Market Opportunity, Growth Drivers, Industry Trend Analysis, and Forecast 2025 - 2034 |
||||||
2024年,全球电动轮椅市场规模达49亿美元,预计2034年将以5.9%的复合年增长率成长至89亿美元。这一增长源于全球残疾人比例上升、神经系统疾病盛行率上升以及助行器技术的快速进步。电池供电的行动解决方案能够在手动移动困难或无法移动的情况下提供独立性,从而显着提高生活品质。配备感测器和摄影机的智慧轮椅的推出标誌着一项关键性进步,使用户(尤其是神经系统疾病患者)能够透过即时回馈安全地在环境中导航。这些智慧型设备不仅提高了行动性,还为医疗保健提供者提供了宝贵的行为洞察。未满足的医疗需求、快速的技术进步和不断变化的人口结构共同作用,清楚地解释了为什么电动轮椅在医疗保健和个人独立方面变得不可或缺。
这些设备整合了尖端技术,优先考虑使用者的安全和独立性,引领着克服行动障碍的趋势。它们配备先进的传感器、直觉的控制装置和人工智慧导航,可根据个人需求提供更智慧、更响应迅速的操作。自主功能减少了对护理人员的依赖,使用户能够更自由地在各种环境中自信地行动。这些助行器将创新与人体工学设计相结合,不仅增强了身体的可及性,还提高了整体生活质量,促进了社会包容和情感健康。随着技术的不断发展,电动助行器正变得越来越适应性强、可靠且用户友好,为个人化助行支援树立了新的标准。
| 市场范围 | |
|---|---|
| 起始年份 | 2024 |
| 预测年份 | 2025-2034 |
| 起始值 | 49亿美元 |
| 预测值 | 89亿美元 |
| 复合年增长率 | 5.9% |
电动轮椅市场在2024年引领市场,规模达31亿美元,为室内外用户提供无缝、轻鬆的行动体验。电动轮椅拥有独立驱动、站立式和便携式等多种选择,用户可享受高度可自订的功能,例如可调节坐垫、符合人体工学的靠背和先进的空间倾斜机制——这些改进不仅提升了舒适度,还有助于康復,并减少继发性健康问题。
预计到2034年,成年人口市场规模将达到70亿美元,其中老年人是最大的使用者群体。老年人群体中残疾人士的日益增多,是重要的成长动力。电动代步车在简化日常任务、增强用户自主性以及最大程度减少疲劳方面发挥着至关重要的作用,而这些优势对于老年人来说至关重要,因为老年人中近40%面临行动不便的问题。
2024年,美国电动代步设备市场规模达16亿美元,这得益于神经系统疾病、脊髓损伤和人口老化的增加。优惠的报销政策加上更高的可支配收入,加速了高端电动轮椅和代步车的普及,进一步增强了市场的成长动能。
全球动力移动出行设备市场的领先品牌包括 PRIDE MOBILITY、GOLDEN、Drive DeVilbiss Healthcare、KARMAN、INVACARE、Hoveround Mobility Solutions、Airwheel、Decon Mobility、MEYRA、Permobil、Ottobock、OSTRICH、Merits、LEVO 和 Frido。这些公司正在重新调整创新、资金和设计,以满足用户需求。领先的製造商正在透过研发整合感测器、物联网连接和人工智慧导航的智慧功能来实现差异化,从而提供更安全、数据更丰富的行动出行解决方案。
他们正在透过模组化设计(可更换驱动单元、可调节座椅和站立机构)扩展产品组合,以适应更广泛的用户和情况。各公司正在与医疗保健提供者和付款人建立合作伙伴关係,以降低成本障碍并改善报销途径,同时针对老年人和神经系统残疾患者进行定向行销。对利基创新企业的策略性收购以及合资企业,有助于公司开拓新技术和地理市场。
目录
第一章:方法论与范围
第二章:执行摘要
第三章:行业洞察
- 产业生态系统分析
- 供应商格局
- 每个阶段的增值
- 影响价值链的因素
- 产业衝击力
- 成长动力
- 神经系统疾病盛行率不断上升
- 动力移动产品的技术进步
- 老年人口比例上升
- 全球残疾盛行率不断上升
- 产业陷阱与挑战
- 电动轮椅成本高
- 严格的监管框架
- 机会
- 专注于轻巧可折迭的电动轮椅
- 成长动力
- 成长潜力分析
- 监管格局
- 北美洲
- 欧洲
- 技术和创新格局
- 当前的技术趋势
- 新兴技术
- 按产品类型分類的价格趋势
- 未来市场趋势
- 报销场景
- 消费者行为分析
- 差距分析
- 波特的分析
- PESTEL分析
第四章:竞争格局
- 介绍
- 公司市占率分析
- 全球的
- 北美洲
- 欧洲
- 世界其他地区
- 公司矩阵分析
- 主要市场参与者的竞争分析
- 竞争定位矩阵
- 关键进展
- 併购
- 伙伴关係和合作
- 新产品发布
- 扩张计划
第五章:市场估计与预测:依产品类型,2021 - 2034 年
- 主要趋势
- 电动轮椅
- 后轮
- 中轮
- 前轮
- 其他类型
- 机动车辆
- 三轮设备
- 四轮设备
- 五轮设备
- 动力附加装置或推进辅助装置
第六章:市场估计与预测:按患者,2021 - 2034 年
- 主要趋势
- 成人
- 儿科
第七章:市场估计与预测:按配销通路,2021 - 2034 年
- 主要趋势
- 实体店面
- 线上通路
第八章:市场估计与预测:依最终用途,2021 - 2034 年
- 主要趋势
- 居家护理
- 復健中心
- 医院
- 其他最终用途
第九章:市场估计与预测:按地区,2021 - 2034 年
- 主要趋势
- 北美洲
- 我们
- 加拿大
- 欧洲
- 德国
- 英国
- 法国
- 西班牙
- 义大利
- 荷兰
- 亚太地区
- 中国
- 日本
- 印度
- 澳洲
- 韩国
- 拉丁美洲
- 巴西
- 墨西哥
- 阿根廷
- 中东和非洲
- 南非
- 沙乌地阿拉伯
- 阿联酋
第十章:公司简介
- Airwheel
- decon
- drive DeVilbiss Healthcare
- Frido
- GOLDEN
- Hoveround Mobility Solutions
- INVACARE
- KARMAN
- LEVO
- merits
- MEYRA
- OSTRICH
- ottobock
- permobil
- PRIDE MOBILITY
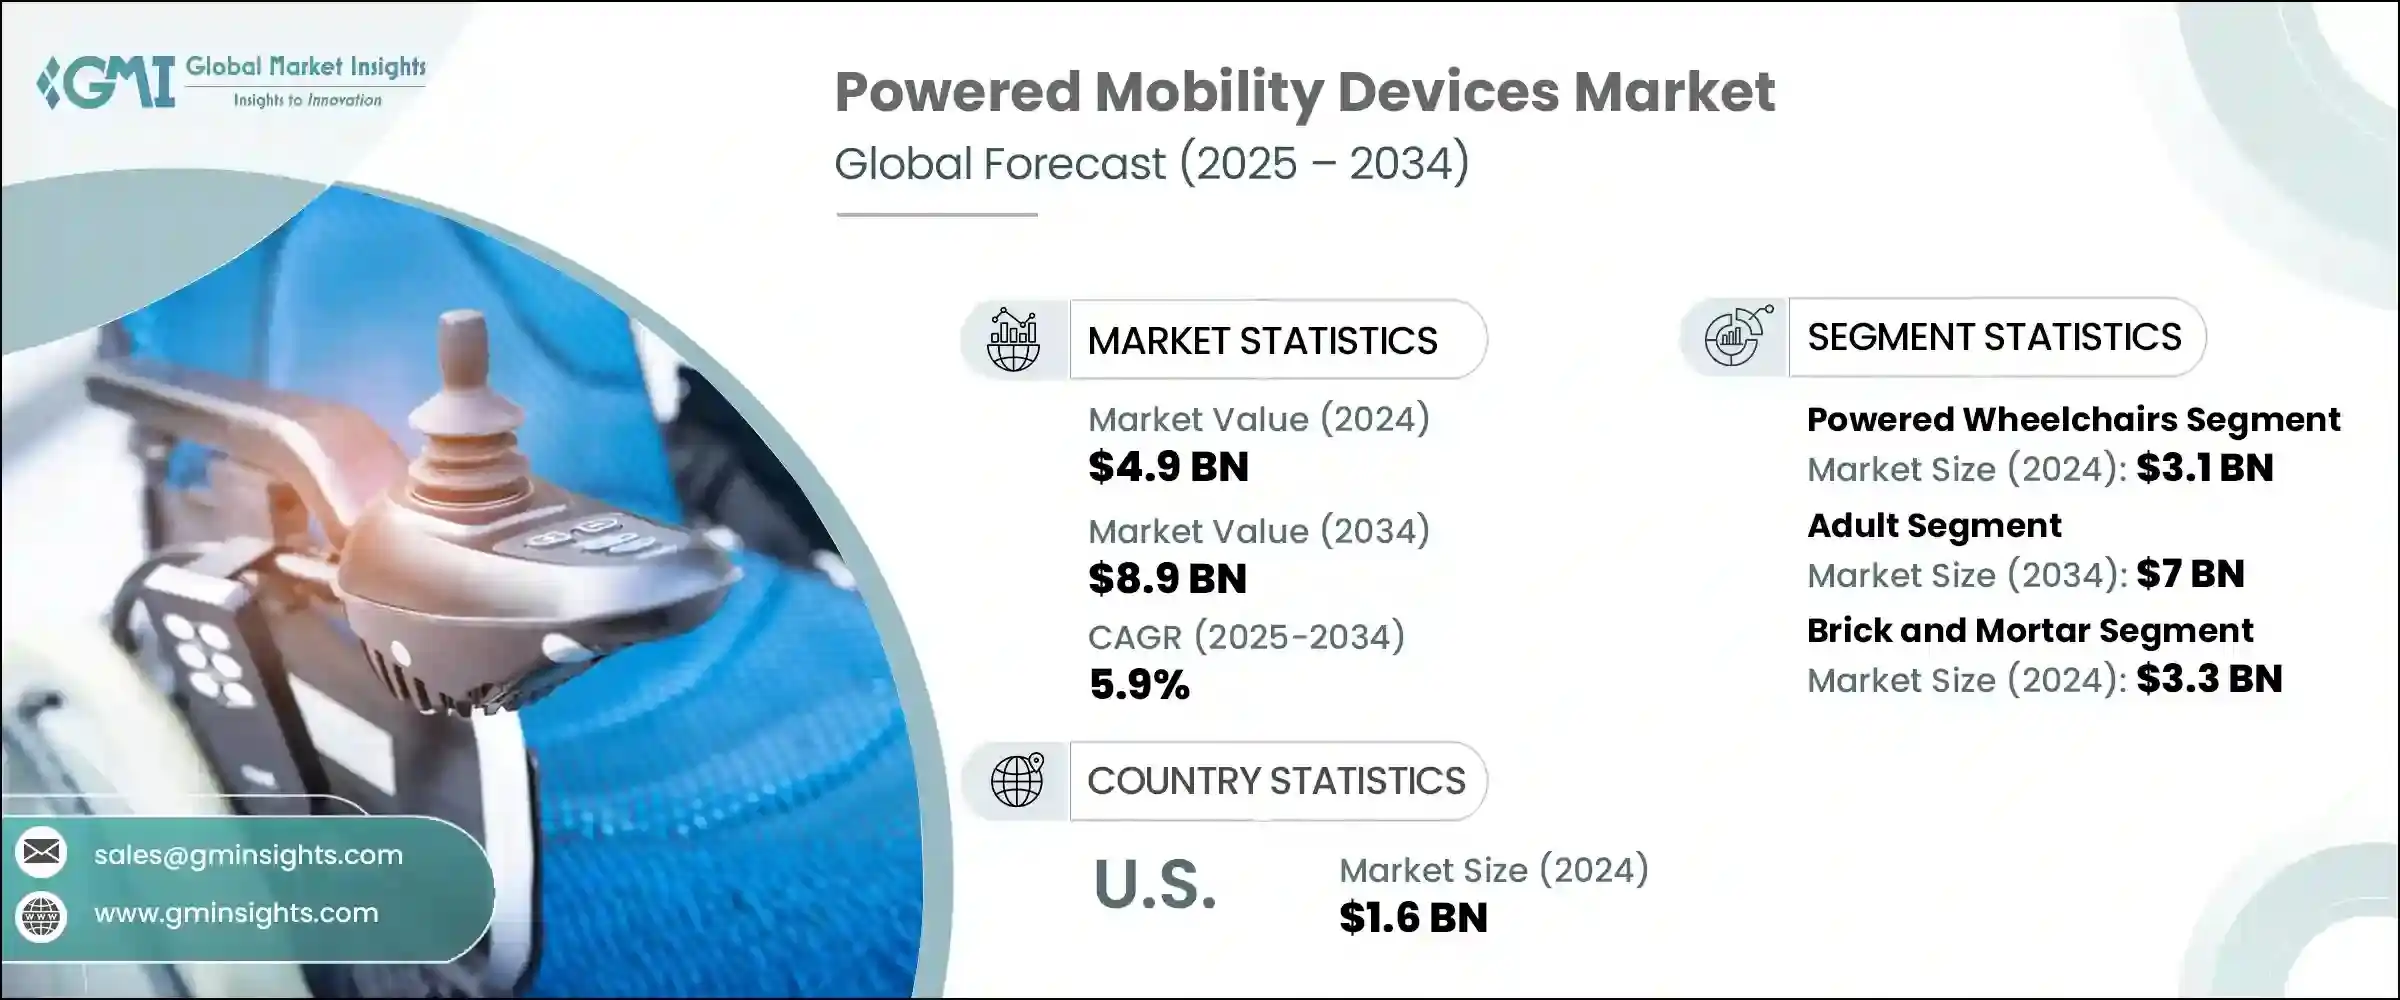
The Global Powered Mobility Devices Market was valued at USD 4.9 billion in 2024 and is estimated to grow at a CAGR of 5.9% to reach USD 8.9 billion by 2034. This surge is due to rising global disability rates, increased prevalence of neurological conditions, and rapid technological progress in mobility aids. Battery-powered mobility solutions offer independence where manual movement is challenging or impossible, significantly enhancing quality of life. The introduction of smart wheelchairs with sensors and cameras marks a pivotal advancement, enabling users-especially those with neurological challenges-to navigate environments safely with real-time feedback. These intelligent devices not only boost mobility but also support healthcare providers with valuable behavior insights. The convergence of unmet medical needs, rapid technological advancements, and evolving demographic patterns clearly explains why powered mobility devices are becoming indispensable in healthcare and personal independence.
These devices lead the way in overcoming mobility barriers by integrating cutting-edge technology that prioritizes user safety and independence. Equipped with advanced sensors, intuitive controls, and AI-powered navigation, they offer smarter, more responsive operations tailored to individual needs. Autonomous features reduce the reliance on caregivers, allowing users greater freedom to move confidently in various environments. By combining innovation with ergonomic design, these mobility aids not only enhance physical accessibility but also improve overall quality of life, fostering social inclusion and emotional well-being. As technology continues to evolve, powered mobility devices are becoming more adaptive, reliable, and user-friendly, setting new standards in personalized mobility support.
| Market Scope | |
|---|---|
| Start Year | 2024 |
| Forecast Year | 2025-2034 |
| Start Value | $4.9 Billion |
| Forecast Value | $8.9 Billion |
| CAGR | 5.9% |
The powered wheelchair segment led the market in 2024, reaching USD 3.1 billion, by providing seamless, effortless movement both indoors and outdoors. With diverse options such as independent drive, standing wheelchairs, and portable units, users benefit from highly customizable features like adjustable cushions, ergonomic backrests, and advanced tilt-in-space mechanisms-enhancements that not only improve comfort but also support rehabilitation and reduce secondary health issues.
The adult population segment is expected to reach USD 7 billion by 2034, especially seniors form the largest base of users. The increasing prevalence of disabilities within this demographic is a significant growth driver. Powered mobility devices play a vital role in simplifying everyday tasks, enhancing user autonomy, and minimizing fatigue-benefits that are crucial for older adults, nearly 40% of whom face mobility limitations.
United States Powered Mobility Devices Market was valued at USD 1.6 billion in 2024, supported by a rise in neurological conditions, spinal cord injuries, and an aging population. Favorable reimbursement policies combined with higher disposable incomes have accelerated the adoption of premium electric wheelchairs and mobility scooters, further strengthening the market's growth momentum.
Leading brands in the Global Powered Mobility Devices Market include PRIDE MOBILITY, GOLDEN, Drive DeVilbiss Healthcare, KARMAN, INVACARE, Hoveround Mobility Solutions, Airwheel, Decon Mobility, MEYRA, Permobil, Ottobock, OSTRICH, Merits, LEVO, and Frido. These companies are reshuffling innovation, funding, and design to meet user demands. Leading manufacturers are differentiating through R&D of intelligent features-integrating sensors, IoT connectivity, and AI-driven navigation-to offer safer, data-enriched mobility solutions..
They are expanding portfolios with modular designs-swappable drive units, adjustable seating, and standing mechanisms-to accommodate a wider range of users and conditions. Firms are forging partnerships with healthcare providers and payers to reduce cost barriers and improve reimbursement pathways, while targeted marketing addresses seniors and individuals with neurological disabilities. Strategic acquisitions of niche innovators, along with joint ventures, help companies tap new technologies and geographic markets.
Table of Contents
Chapter 1 Methodology and Scope
- 1.1 Market scope and definitions
- 1.2 Research design
- 1.2.1 Research approach
- 1.2.2 Data collection methods
- 1.3 Data mining sources
- 1.3.1 Global
- 1.3.2 Regional/Country
- 1.4 Base estimates and calculations
- 1.4.1 Base year calculation
- 1.4.2 Key trends for market estimation
- 1.5 Primary research and validation
- 1.5.1 Primary sources
- 1.6 Forecast model
- 1.7 Research assumptions and limitations
Chapter 2 Executive Summary
- 2.1 Industry 3600 synopsis
- 2.2 Key market trends
- 2.2.1 Regional
- 2.2.2 Product type
- 2.2.3 Patient
- 2.2.4 Distribution channel
- 2.2.5 End use
- 2.3 CXO perspectives: Strategic imperatives
- 2.3.1 Key decision points for industry executives
- 2.3.2 Critical success factors for market players
- 2.4 Future outlook and strategic recommendations
Chapter 3 Industry Insights
- 3.1 Industry ecosystem analysis
- 3.1.1 Supplier landscape
- 3.1.2 Value addition at each stage
- 3.1.3 Factor affecting the value chain
- 3.2 Industry impact forces
- 3.2.1 Growth drivers
- 3.2.1.1 Growing prevalence of neurological diseases
- 3.2.1.2 Technological advancements in powered mobility products
- 3.2.1.3 Rising percentage of geriatric population
- 3.2.1.4 Increasing prevalence of disabilities worldwide
- 3.2.2 Industry pitfalls and challenges
- 3.2.2.1 High cost of powered wheelchairs
- 3.2.2.2 Stringent regulatory framework
- 3.2.3 Opportunities
- 3.2.3.1 Focus on lightweight and foldable electric wheelchairs
- 3.2.1 Growth drivers
- 3.3 Growth potential analysis
- 3.4 Regulatory landscape
- 3.4.1 North America
- 3.4.2 Europe
- 3.5 Technology and innovation landscape
- 3.5.1 Current technological trends
- 3.5.2 Emerging technologies
- 3.6 Price trends, by product type
- 3.7 Future market trends
- 3.8 Reimbursement scenario
- 3.9 Consumer behaviour analysis
- 3.10 Gap analysis
- 3.11 Porter's analysis
- 3.12 PESTEL analysis
Chapter 4 Competitive Landscape, 2024
- 4.1 Introduction
- 4.2 Company market share analysis
- 4.2.1 Global
- 4.2.2 North America
- 4.2.3 Europe
- 4.2.4 Rest of the world
- 4.3 Company matrix analysis
- 4.4 Competitive analysis of major market players
- 4.5 Competitive positioning matrix
- 4.6 Key developments
- 4.6.1 Mergers and acquisitions
- 4.6.2 Partnerships and collaborations
- 4.6.3 New product launches
- 4.6.4 Expansion plans
Chapter 5 Market Estimates and Forecast, By Product Type, 2021 - 2034 ($ Mn)
- 5.1 Key trends
- 5.2 Powered wheelchairs
- 5.2.1 Rear wheel
- 5.2.2 Mid-wheel
- 5.2.3 Front wheel
- 5.2.4 Other types
- 5.3 Power operated vehicles
- 5.3.1 3-wheel devices
- 5.3.2 4-wheel devices
- 5.3.3 5-wheel devices
- 5.4 Power add-on or propulsion-assist units
Chapter 6 Market Estimates and Forecast, By Patient, 2021 - 2034 ($ Mn)
- 6.1 Key trends
- 6.2 Adult
- 6.3 Pediatric
Chapter 7 Market Estimates and Forecast, By Distribution Channel, 2021 - 2034 ($ Mn)
- 7.1 Key trends
- 7.2 Brick and mortar
- 7.3 Online channel
Chapter 8 Market Estimates and Forecast, By End Use, 2021 - 2034 ($ Mn)
- 8.1 Key trends
- 8.2 Home care
- 8.3 Rehabilitation centers
- 8.4 Hospitals
- 8.5 Other end use
Chapter 9 Market Estimates and Forecast, By Region, 2021 - 2034 ($ Mn)
- 9.1 Key trends
- 9.2 North America
- 9.2.1 U.S.
- 9.2.2 Canada
- 9.3 Europe
- 9.3.1 Germany
- 9.3.2 UK
- 9.3.3 France
- 9.3.4 Spain
- 9.3.5 Italy
- 9.3.6 Netherlands
- 9.4 Asia Pacific
- 9.4.1 China
- 9.4.2 Japan
- 9.4.3 India
- 9.4.4 Australia
- 9.4.5 South Korea
- 9.5 Latin America
- 9.5.1 Brazil
- 9.5.2 Mexico
- 9.5.3 Argentina
- 9.6 Middle East and Africa
- 9.6.1 South Africa
- 9.6.2 Saudi Arabia
- 9.6.3 UAE
Chapter 10 Company Profiles
- 10.1 Airwheel
- 10.2 decon
- 10.3 drive DeVilbiss Healthcare
- 10.4 Frido
- 10.5 GOLDEN
- 10.6 Hoveround Mobility Solutions
- 10.7 INVACARE
- 10.8 KARMAN
- 10.9 LEVO
- 10.10 merits
- 10.11 MEYRA
- 10.12 OSTRICH
- 10.13 ottobock
- 10.14 permobil
- 10.15 PRIDE MOBILITY


