


 |
市场调查报告书
商品编码
1666626
CBRNE 国防市场机会、成长动力、产业趋势分析与 2025 - 2034 年预测CBRNE Defense Market Opportunity, Growth Drivers, Industry Trend Analysis, and Forecast 2025 - 2034 |
||||||
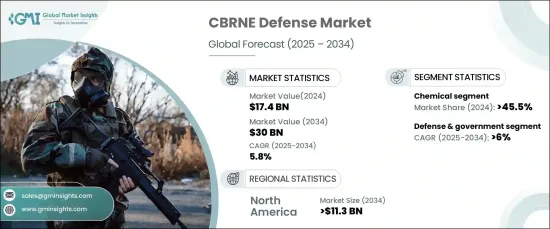
全球 CBRNE 防御市场估值将于 2024 年达到 174 亿美元,预计 2025 年至 2034 年期间的复合年增长率为 5.8%。世界各国政府和组织都优先投资最先进的技术,以有效降低这些风险。从自主检测系统和穿戴式防护装备到先进的净化解决方案,人们正在开发各种创新工具来应对故意和意外的CBRNE事件。
此外,人工智慧 (AI) 和物联网 (IoT) 等尖端技术融入 CBRNE 防御系统,彻底改变了威胁侦测和回应能力。即时资料处理、预测分析和增强的态势感知现在使当局能够更有效地识别和消除威胁。创新与必需品的融合推动着市场的强劲成长轨迹。在安全挑战性质不断变化的世界中,主动措施和 CBRNE 防御解决方案的持续进步对于保护社区、关键基础设施和国家安全已变得不可或缺。
| 市场范围 | |
|---|---|
| 起始年份 | 2024 |
| 预测年份 | 2025-2034 |
| 起始值 | 174亿美元 |
| 预测值 | 300亿美元 |
| 复合年增长率 | 5.8% |
市场按设备类型细分,其中化学、生物、放射、核和爆炸防御解决方案发挥关键作用。 2024 年,化学防御领域将占据市场主导地位,占有 45.5% 的份额。该领域的突出地位归功于检测技术的不断创新,包括可快速识别有毒工业化学品和化学战剂的便携式感测器和手持设备。这些工具使军事和民事团队能够迅速有效地做出反应。此外,化学威胁的日益频繁增加了对先进个人防护设备(PPE)和净化系统的需求,从而推动了该领域的扩张。
CBRNE 国防市场的最终用户类别包括国防和政府、国土安全以及民用和商业部门。到 2034 年,国防和政府部门预计将以 6% 的复合年增长率增长。不断加剧的地缘政治紧张局势和迫在眉睫的化生核爆武器部署威胁进一步加速了该领域的投资。
在北美,CBRNE 防御市场预计到 2034 年将创造 113 亿美元的产值。这些创新提高了效率和安全性,能够有效降低危险环境中的CBRNE风险。
目录
第 1 章:方法论与范围
- 市场范围和定义
- 基础估算与计算
- 预测计算
- 资料来源
- 基本的
- 次要
- 付费来源
- 公共资源
第 2 章:执行摘要
第 3 章:产业洞察
- 产业生态系统分析
- 影响价值链的因素
- 利润率分析
- 中断
- 未来展望
- 製造商
- 经销商
- 供应商概况
- 利润率分析
- 重要新闻及倡议
- 监管格局
- 衝击力
- 成长动力
- 地缘政治紧张局势和安全威胁加剧
- 军民部门加强合作,共同推动综合 CBRNE 防御
- 政府对国防和国土安全的投资
- 更重视战备与训练计划
- 无人系统、无人机和机器人的整合度不断提高,可用于远端 CBRNE 检测
- 产业陷阱与挑战
- 先进技术开发和部署成本高昂
- 整合和互通性问题
- 成长动力
- 成长潜力分析
- 波特的分析
- PESTEL 分析
第四章:竞争格局
- 介绍
- 公司市占率分析
- 竞争定位矩阵
- 战略展望矩阵
第 5 章:市场估计与预测:按类型,2021 年至 2034 年
- 主要趋势
- 化学
- 生物
- 放射学
- 核
- 霹雳
第 6 章:市场估计与预测:按设备,2021 年至 2034 年
- 主要趋势
- 防护型穿戴装置
- 防护服
- 防毒面具和头罩
- 逃生装置/逃生头罩
- 防护鞋
- 防护手套
- 呼吸系统
- 自给式呼吸器 (SCBA)
- 动力送风净化呼吸器 (PAPR)
- 侦测和监控系统
- 热像仪
- 感应器
- 固定和移动监测设备
- 采样设备
- 筛检检测试剂盒
- 红外线光谱
- 灯塔
- 隔离探测器
- 气体探测器
- 生物威胁探测器
- 放射性威胁探测器
- 净化系统
- 污染指示器净化保证系统 (CIDAS)
- 喷雾装置
- 其他的
- 模拟器
第 7 章:市场估计与预测:按最终用户,2021 年至 2034 年
- 主要趋势
- 国防与政府
- 武装部队
- 空军
- 军队
- 海军
- 武装部队
- 国土安全
- 警察
- 消防安全部门
- 民事及商业
第 8 章:市场估计与预测:按地区,2021 年至 2034 年
- 主要趋势
- 北美洲
- 我们
- 加拿大
- 欧洲
- 英国
- 德国
- 法国
- 义大利
- 西班牙
- 俄罗斯
- 亚太地区
- 中国
- 印度
- 日本
- 韩国
- 澳洲
- 拉丁美洲
- 巴西
- 墨西哥
- 中东及非洲
- 南非
- 沙乌地阿拉伯
- 阿联酋
第九章:公司简介
- Argon Electronics
- Avon Protection
- Battelle
- Bruker
- Chemring Group
- INDRA
- Karcher Futuretech
- KNDS
- Leidos
- Rheinmetall
- Saab
- Smiths Group
- Teledyne FLIR
- Thales
The Global CBRNE Defense Market, with its valuation reaching USD 17.4 billion in 2024, is projected to grow at a CAGR of 5.8% from 2025 to 2034. This expansion is fueled by the escalating threat of asymmetric warfare, combined with an increasing risk of chemical, biological, radiological, nuclear, and explosive (CBRNE) incidents. Governments and organizations worldwide are prioritizing investments in state-of-the-art technologies to mitigate these risks effectively. From autonomous detection systems and wearable protective gear to advanced decontamination solutions, a wide array of innovative tools is being developed to address both intentional and accidental CBRNE events.
Additionally, the incorporation of cutting-edge technologies such as artificial intelligence (AI) and the Internet of Things (IoT) into CBRNE defense systems has revolutionized threat detection and response capabilities. Real-time data processing, predictive analytics, and enhanced situational awareness now enable authorities to identify and neutralize threats more efficiently. This convergence of innovation and necessity is driving the market's robust growth trajectory. In a world where the nature of security challenges is constantly evolving, proactive measures and continuous advancements in CBRNE defense solutions have become indispensable for safeguarding communities, critical infrastructure, and national security.
| Market Scope | |
|---|---|
| Start Year | 2024 |
| Forecast Year | 2025-2034 |
| Start Value | $17.4 Billion |
| Forecast Value | $30 Billion |
| CAGR | 5.8% |
The market is segmented by equipment type, with chemical, biological, radiological, nuclear, and explosive defense solutions playing a critical role. In 2024, the chemical defense segment dominated the market, commanding 45.5% of the share. This segment's prominence is attributed to ongoing innovations in detection technologies, including portable sensors and handheld devices that can rapidly identify toxic industrial chemicals and chemical warfare agents. These tools enable swift and effective responses from military and civilian teams alike. Furthermore, the growing frequency of chemical threats has heightened the demand for advanced personal protective equipment (PPE) and decontamination systems, fueling the segment's expansion.
End-user categories for the CBRNE defense market include defense and government, homeland security, and civil and commercial sectors. The defense and government sector is expected to grow at a CAGR of 6% through 2034. Global governments are intensifying their efforts to fortify CBRNE defenses, resulting in increased spending on detection tools, protective equipment, and decontamination solutions for military operations. Rising geopolitical tensions and the looming threat of CBRNE weapon deployment further accelerate investments in this sector.
In North America, the CBRNE defense market is poised to generate USD 11.3 billion by 2034. The region is at the forefront of leveraging advanced technologies, with autonomous systems like drones and robots now integral to detection and response operations. These innovations enhance efficiency and safety, enabling effective mitigation of CBRNE risks in hazardous environments.
Table of Contents
Chapter 1 Methodology & Scope
- 1.1 Market scope & definitions
- 1.2 Base estimates & calculations
- 1.3 Forecast calculations
- 1.4 Data sources
- 1.4.1 Primary
- 1.4.2 Secondary
- 1.4.2.1 Paid sources
- 1.4.2.2 Public sources
Chapter 2 Executive Summary
- 2.1 Industry synopsis, 2021-2034
Chapter 3 Industry Insights
- 3.1 Industry ecosystem analysis
- 3.1.1 Factor affecting the value chain
- 3.1.2 Profit margin analysis
- 3.1.3 Disruptions
- 3.1.4 Future outlook
- 3.1.5 Manufacturers
- 3.1.6 Distributors
- 3.2 Supplier landscape
- 3.3 Profit margin analysis
- 3.4 Key news & initiatives
- 3.5 Regulatory landscape
- 3.6 Impact forces
- 3.6.1 Growth drivers
- 3.6.1.1 Rising geopolitical tensions and security threats
- 3.6.1.2 Growing cooperation between military and civilian sectors for integrated CBRNE defense
- 3.6.1.3 Government investments in defense and homeland security
- 3.6.1.4 Increasing focus on readiness and training programs
- 3.6.1.5 Rising integration of unmanned systems, drones, and robotics for remote CBRNE detection
- 3.6.2 Industry pitfalls & challenges
- 3.6.2.1 High costs of advanced technology development and deployment
- 3.6.2.2 Integration and interoperability issues
- 3.6.1 Growth drivers
- 3.7 Growth potential analysis
- 3.8 Porter’s analysis
- 3.9 PESTEL analysis
Chapter 4 Competitive Landscape, 2024
- 4.1 Introduction
- 4.2 Company market share analysis
- 4.3 Competitive positioning matrix
- 4.4 Strategic outlook matrix
Chapter 5 Market Estimates & Forecast, By Type, 2021-2034 (USD Million)
- 5.1 Key trends
- 5.2 Chemical
- 5.3 Biological
- 5.4 Radiological
- 5.5 Nuclear
- 5.6 Explosive
Chapter 6 Market Estimates & Forecast, By Equipment, 2021-2034 (USD Million)
- 6.1 Key trends
- 6.2 Protective wearables
- 6.2.1 Protective clothing
- 6.2.2 Protective gas mask and hoods
- 6.2.3 Escape devices/hoods
- 6.2.4 Protective shoes
- 6.2.5 Protective gloves
- 6.3 Respiratory systems
- 6.3.1 Self-contained breathing apparatus (SCBA)
- 6.3.2 Powered Air Purifying Respirator (PAPR)
- 6.4 Detection & monitoring systems
- 6.4.1 Thermal imagers
- 6.4.2 Sensors
- 6.4.3 Stationary and mobile monitoring devices
- 6.4.4 Sampling equipment
- 6.4.5 Screening test kit
- 6.4.6 Infrared spectroscopy
- 6.4.7 Beacon
- 6.4.8 Stand-off detectors
- 6.4.9 Gas detectors
- 6.4.10 Biological threat detectors
- 6.4.11 Radiological threat detectors
- 6.5 Decontamination systems
- 6.5.1 Contamination Indicator Decontamination Assurance Systems (CIDAS)
- 6.5.2 Spray unit
- 6.5.3 Others
- 6.6 Simulators
Chapter 7 Market Estimates & Forecast, By End-user, 2021-2034 (USD Million)
- 7.1 Key trends
- 7.2 Defense & government
- 7.2.1 Armed forces
- 7.2.1.1 Air force
- 7.2.1.2 Army
- 7.2.1.3 Navy
- 7.2.1 Armed forces
- 7.3 Homeland security
- 7.3.1 Police
- 7.3.2 Fire safety department
- 7.4 Civil & commercial
Chapter 8 Market Estimates & Forecast, By Region, 2021-2034 (USD Million)
- 8.1 Key trends
- 8.2 North America
- 8.2.1 U.S.
- 8.2.2 Canada
- 8.3 Europe
- 8.3.1 UK
- 8.3.2 Germany
- 8.3.3 France
- 8.3.4 Italy
- 8.3.5 Spain
- 8.3.6 Russia
- 8.4 Asia Pacific
- 8.4.1 China
- 8.4.2 India
- 8.4.3 Japan
- 8.4.4 South Korea
- 8.4.5 Australia
- 8.5 Latin America
- 8.5.1 Brazil
- 8.5.2 Mexico
- 8.6 MEA
- 8.6.1 South Africa
- 8.6.2 Saudi Arabia
- 8.6.3 UAE
Chapter 9 Company Profiles
- 9.1 Argon Electronics
- 9.2 Avon Protection
- 9.3 Battelle
- 9.4 Bruker
- 9.5 Chemring Group
- 9.6 INDRA
- 9.7 Karcher Futuretech
- 9.8 KNDS
- 9.9 Leidos
- 9.10 Rheinmetall
- 9.11 Saab
- 9.12 Smiths Group
- 9.13 Teledyne FLIR
- 9.14 Thales
 化学、生物、放射性及核能(CBRN)安全市场分析及预测(至2035年):类型、产品类型、服务、技术、组件、应用、设备、部署类型及最终用户
 全球防爆反应装甲(ERA)瓦片市场(2026-2036)全球化学、生物、放射性及核能(CBRN)市场:2026-2036
 CBRN防御市场-全球产业规模、份额、趋势、机会及预测(按类型、设备、用途、最终用途、地区和竞争格局划分,2021-2031年)
 CBRNE威胁侦测设备市场按技术类型、应用、最终用户和销售管道- 全球预测 2026-2032
 CBRNE防御市场规模、份额和成长分析(按部署类型、组件、最终用户和地区划分)-产业预测(2026-2033年)
 2025年全球化学、生物、放射性、核子及爆炸物(CBRNE)威胁侦测设备市场报告2025年化学、生物、放射和核子(CBRN)防护工具全球市场报告CBRN 国防市场(按解决方案类型、CBRN 模式、应用和最终用户划分)—2025 年至 2032 年全球预测2025年CBRNE国防全球市场报告