


 |
市场调查报告书
商品编码
1936562
机械安全市场机会、成长要素、产业趋势分析及预测(2026年至2035年)Machine Safety Market Opportunity, Growth Drivers, Industry Trend Analysis, and Forecast 2026 - 2035 |
||||||
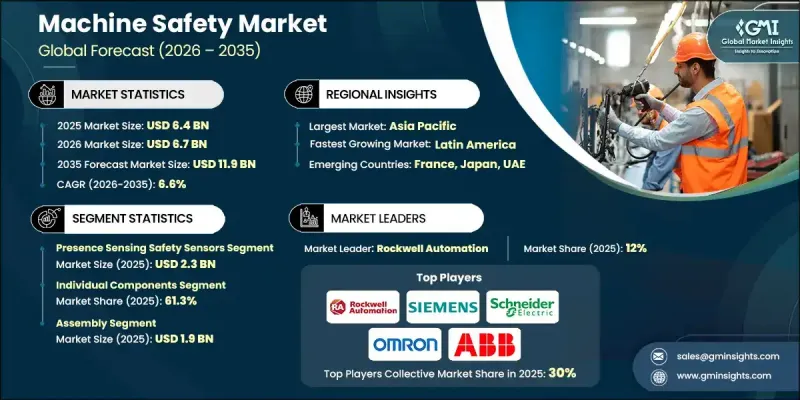
全球机械安全市场预计到 2025 年将达到 64 亿美元,到 2035 年将达到 119 亿美元,年复合成长率为 6.6%。
日益增长的监管压力、投资者期望以及社会对更安全、更永续的工业运作的需求,正在加速产业对相关技术的应用。企业正在扩大对能够最大限度减少环境影响、减少废弃物、优化资源利用和实现设施电气化的技术的应用,同时整合可再生能源和水循环利用系统。现代机器安全解决方案还支援即时监控、低影响营运监管和负责任的供应商追踪,以确保营运透明度和合规性。这些发展在工业环境中尤其重要,因为自动化和高风险机械需要强大的安全系统。在永续性、营运效率和工人保护的驱动下,全球各工业部门正在投资先进的安全控制器、感测器和联锁系统。
| 市场覆盖范围 | |
|---|---|
| 开始年份 | 2025 |
| 预测年份 | 2026-2035 |
| 起始值 | 64亿美元 |
| 预测金额 | 119亿美元 |
| 复合年增长率 | 6.6% |
预计到2025年,人体存在检测安全感测器市场规模将达23亿美元。这些感测器能够侦测员工或物体何时进入危险区域,并立即停止机器运转,从而减少工伤事故。其非接触式特性使其成为职场屏障可能干扰工作流程或限制人员进出的应用场景的理想选择。
到2025年,独立组件细分市场将占据61.3%的市场。独立的安全组件可单独安装在机器上,为具有不同安全要求的新旧机器和设备提供客製化的保护。这种方法既能实现经济高效的升级,又能确保提供针对性的安全解决方案。
预计2025年,美国机械安全市场规模将达到10亿美元,占全球市场份额的55.3%。强劲的监管力度、高度普及的工业自动化以及成熟的製造业基础是推动市场成长的主要因素。汽车、电子、食品加工和物流等产业的生产线现代化进程不断推进,带动了对先进安全技术的需求,这些技术能够实现预测性维护、人机协作和营运可视性。
目录
第一章调查方法和范围
第二章执行摘要
第三章业界考察
- 生态系分析
- 供应商情况
- 利润率
- 每个阶段的附加价值
- 影响价值链的因素
- 产业影响因素
- 司机
- 人们越来越关注永续和环境友善采矿方法
- 工业自动化程度不断提高
- 提高对职场安全的认识
- 产业潜在风险与挑战
- 高昂的初始投资成本
- 熟练劳动力短缺
- 机会
- 工业4.0和智慧工厂的兴起
- 协作机器人(cobot)的发展
- 司机
- 成长潜力分析
- 未来市场趋势
- 科技与创新趋势
- 当前技术趋势
- 新兴技术
- 价格趋势
- 按地区
- 按组件
- 监管环境
- 标准和合规要求
- 区域法规结构
- 认证标准
- 波特五力分析
- PESTEL 分析
第四章 竞争情势
- 介绍
- 公司市占率分析
- 按地区
- 企业矩阵分析
- 主要市场公司的竞争分析
- 竞争定位矩阵
- 重大进展
- 併购
- 伙伴关係与合作
- 新产品发布
- 扩张计划
第五章 按组件分類的市场估算与预测,2022-2035年
- 存在检测安全感测器
- 安全边缘
- 雷射扫描仪
- 安全光栅
- 安全垫
- 安全摄影机系统
- 其他设备(单光束和多光束设备)
- 安全联锁切换
- 电子机械
- 铰链销
- 限位开关
- 非接触式联锁切换
- 舌形联锁切换
- 钥匙联锁切换
- 安全控制器/模组/继电器
- 可程式安全应用
- 紧急停止装置
- 双手安全装置
第六章 依实施类型分類的市场估计与预测,2022-2035年
- 各个组件
- 内建组件
第七章 按应用领域分類的市场估算与预测,2022-2035年
- 组装
- 机器人技术
- 包装
- 物料输送
- 金属加工
8. 2022-2035年按最终用途产业分類的市场估算与预测
- 石油和天然气
- 航太
- 半导体和电子装置
- 食品/饮料
- 车
- 卫生保健
- 其他的
第九章 2022-2035年各地区市场估算与预测
- 北美洲
- 我们
- 加拿大
- 欧洲
- 德国
- 英国
- 法国
- 义大利
- 西班牙
- 亚太地区
- 中国
- 日本
- 印度
- 澳洲
- 韩国
- 拉丁美洲
- 巴西
- 墨西哥
- 阿根廷
- 中东和非洲
- 南非
- 沙乌地阿拉伯
- 阿拉伯聯合大公国
第十章:公司简介
- ABB
- Banner Engineering
- Emerson Electric
- Honeywell International
- IDEC
- ISE Controls
- KEYENCE
- Mitsubishi Electric
- OMRON
- Pepperl+Fuchs
- Pilz GmbH
- Rockwell Automation
- Schneider Electric
- SICK
- Siemens
The Global Machine Safety Market was valued at USD 6.4 billion in 2025 and is estimated to grow at a CAGR of 6.6% to reach USD 11.9 billion by 2035.
The industry is witnessing accelerated adoption due to rising regulatory pressures, investor expectations, and community demands for safer and more sustainable industrial operations. Companies are increasingly implementing technologies that minimize environmental impact, reduce waste, optimize resource use, and electrify equipment, while integrating renewable energy and water recycling systems. Modern machine safety solutions also support real-time monitoring, low-impact operational oversight, and responsible supplier tracking, ensuring operational transparency and compliance. These developments are particularly critical in industrial environments where automation and high-risk machinery necessitate robust safety systems. The push toward sustainability, operational efficiency, and worker protection is driving investments in advanced safety controllers, sensors, and interlock systems across industries worldwide.
| Market Scope | |
|---|---|
| Start Year | 2025 |
| Forecast Year | 2026-2035 |
| Start Value | $6.4 Billion |
| Forecast Value | $11.9 Billion |
| CAGR | 6.6% |
The presence-sensing safety sensors segment accounted for USD 2.3 billion in 2025. These sensors detect employees or objects entering hazardous zones and immediately halt machine operations, reducing workplace injuries. Their non-contact functionality makes them ideal for applications where physical barriers may hinder workflow or restrict access.
The individual components segment held a 61.3% share in 2025. Independent safety components are installed separately on machinery, allowing tailored protection for older and newer machines, or for equipment with varying safety requirements. This approach ensures targeted safety solutions while enabling cost-effective upgrades.
U.S. Machine Safety Market held a 55.3% share, generating USD 1 billion in 2025. Growth is supported by strong regulatory enforcement, high industrial automation adoption, and a mature manufacturing base. Industries across automotive, electronics, food processing, and logistics are modernizing production lines, driving demand for advanced safety technologies that enable predictive maintenance, human-machine collaboration, and operational visibility.
Key players in the Global Machine Safety Market include ABB, Banner Engineering, Emerson Electric, Honeywell International, IDEC, ISE Controls, KEYENCE, Mitsubishi Electric, OMRON, Pepperl+Fuchs, Pilz GmbH, Rockwell Automation, Schneider Electric, SICK, and Siemens. Companies in the machine safety market focus on innovation and R&D to enhance product reliability, accuracy, and integration capabilities. They expand their global footprint through strategic partnerships, acquisitions, and local manufacturing setups. Firms emphasize modular and scalable solutions to address diverse machinery requirements, enabling cost-effective retrofits and upgrades. Investment in IoT-enabled devices, predictive analytics, and real-time monitoring strengthens operational efficiency and compliance. Additionally, companies pursue certifications and regulatory adherence to reinforce trust and market credibility, while offering training and support services to build long-term client relationships and maintain a competitive advantage.
Table of Contents
Chapter 1 Methodology and Scope
- 1.1 Market scope and definition
- 1.2 Research design
- 1.2.1 Research approach
- 1.2.2 Data collection methods
- 1.3 Data mining sources
- 1.3.1 Global
- 1.3.2 Regional/Country
- 1.4 Base estimates and calculations
- 1.4.1 Base year calculation
- 1.4.2 Key trends for market estimation
- 1.5 Primary research and validation
- 1.5.1 Primary sources
- 1.6 Forecast model
- 1.7 Research assumptions and limitations
Chapter 2 Executive Summary
- 2.1 Industry 360° synopsis
- 2.2 Key market trends
- 2.2.1 Regional
- 2.2.2 Component
- 2.2.3 Implementation type
- 2.2.4 Application
- 2.2.5 End use industry
- 2.3 CXO perspectives: Strategic imperatives
- 2.3.1 Key decision points for industry executives
- 2.3.2 Critical success factors for market players
- 2.4 Future outlook and strategic recommendations
Chapter 3 Industry Insights
- 3.1 Industry ecosystem analysis
- 3.1.1 Supplier landscape
- 3.1.2 Profit margin
- 3.1.3 Value addition at each stage
- 3.1.4 Factor affecting the value chain
- 3.2 Industry impact forces
- 3.2.1 Growth drivers
- 3.2.1.1 Increased focus on sustainable and environmentally friendly mining practices
- 3.2.1.2 Increasing automation in industries
- 3.2.1.3 Growing awareness about workplace safety
- 3.2.2 Industry pitfalls & challenges
- 3.2.2.1 High initial investment costs
- 3.2.2.2 Lack of skilled workforce
- 3.2.3 Opportunities
- 3.2.3.1 Expansion of industry 4.0 & smart factories
- 3.2.3.2 Growth of collaborative robotics (Cobots)
- 3.2.1 Growth drivers
- 3.3 Growth potential analysis
- 3.4 Future market trends
- 3.5 Technology and innovation landscape
- 3.5.1 Current technological trends
- 3.5.2 Emerging technologies
- 3.6 Price trends
- 3.6.1 By region
- 3.6.2 By component
- 3.7 Regulatory landscape
- 3.7.1 Standards and compliance requirements
- 3.7.2 Regional regulatory frameworks
- 3.7.3 Certification standards
- 3.8 Porter's analysis
- 3.9 PESTEL analysis
Chapter 4 Competitive Landscape, 2025
- 4.1 Introduction
- 4.2 Company market share analysis
- 4.2.1 By region
- 4.2.1.1 North America
- 4.2.1.2 Europe
- 4.2.1.3 Asia Pacific
- 4.2.1.4 Latin America
- 4.2.1.5 Middle East and Africa
- 4.2.1 By region
- 4.3 Company matrix analysis
- 4.4 Competitive analysis of major market players
- 4.5 Competitive positioning matrix
- 4.6 Key developments
- 4.6.1 Mergers & acquisitions
- 4.6.2 Partnerships & collaborations
- 4.6.3 New product launches
- 4.6.4 Expansion plans
Chapter 5 Market Estimates and Forecast, By Component, 2022 - 2035 (USD Billion) (Thousand Units)
- 5.1 Key trends
- 5.2 Presence sensing safety sensors
- 5.2.1 Safety edges
- 5.2.2 Laser scanners
- 5.2.3 Safety light curtains
- 5.2.4 Safety mats
- 5.2.5 Safety camera systems
- 5.2.6 Other devices (single & multi-beam devices)
- 5.3 Safety interlock switches
- 5.3.1 Electromechanical
- 5.3.2 Hinge pins
- 5.3.3 Limit switches
- 5.3.4 Non-contact interlock switches
- 5.3.5 Tongue interlock switches
- 5.3.6 Trapped key interlock switches
- 5.4 Safety controllers/modules/relays
- 5.5 Programmable safety applications
- 5.6 Emergency stop controls
- 5.7 Two-hand safety controls
Chapter 6 Market Estimates and Forecast, By Implementation Type, 2022 - 2035 (USD Billion) (Thousand Units)
- 6.1 Key trends
- 6.2 Individual components
- 6.3 Embedded components
Chapter 7 Market Estimates and Forecast, By Application, 2022 - 2035 (USD Billion) (Thousand Units)
- 7.1 Key trends
- 7.2 Assembly
- 7.3 Robotics
- 7.4 Packaging
- 7.5 Material handling
- 7.6 Metal working
Chapter 8 Market Estimates and Forecast, By End Use Industry, 2022 - 2035 (USD Billion) (Thousand Units)
- 8.1 Key trends
- 8.2 Oil & gas
- 8.3 Aerospace
- 8.4 Semiconductor & electronics
- 8.5 Food & beverages
- 8.6 Automotive
- 8.7 Healthcare
- 8.8 Others
Chapter 9 Market Estimates and Forecast, By Region, 2022 - 2035 (USD Billion) (Thousand Units)
- 9.1 Key trends
- 9.2 North America
- 9.2.1 U.S.
- 9.2.2 Canada
- 9.3 Europe
- 9.3.1 Germany
- 9.3.2 UK
- 9.3.3 France
- 9.3.4 Italy
- 9.3.5 Spain
- 9.4 Asia Pacific
- 9.4.1 China
- 9.4.2 Japan
- 9.4.3 India
- 9.4.4 Australia
- 9.4.5 South Korea
- 9.5 Latin America
- 9.5.1 Brazil
- 9.5.2 Mexico
- 9.5.3 Argentina
- 9.6 Middle East and Africa
- 9.6.1 South Africa
- 9.6.2 Saudi Arabia
- 9.6.3 UAE
Chapter 10 Company Profiles
- 10.1 ABB
- 10.2 Banner Engineering
- 10.3 Emerson Electric
- 10.4 Honeywell International
- 10.5 IDEC
- 10.6 ISE Controls
- 10.7 KEYENCE
- 10.8 Mitsubishi Electric
- 10.9 OMRON
- 10.10 Pepperl+Fuchs
- 10.11 Pilz GmbH
- 10.12 Rockwell Automation
- 10.13 Schneider Electric
- 10.14 SICK
- 10.15 Siemens
 2026年全球机械安全市场报告
 机械安全市场 - 全球产业规模、份额、趋势、机会及预测(按组件、部署方式、产业垂直领域、地区和竞争格局划分,2021-2031 年)
 机械安全市场规模、份额和成长分析(按部署方式、销售管道、应用、产品、组件、垂直产业和地区划分)-2026-2033年产业预测
 全球机械安全市场按组件划分-预测(至2030年)
 全球机械安全市场:2025-2030 年预测
 机械安全市场(按组件、安全功能、连接方式、安装类型和最终用途行业)—2025-2032 年全球预测
 机械安全市场,按实施、按组件、按最终用途行业、按国家和地区 - 2025 年至 2032 年全球行业分析、市场规模、市场份额及预测
 全球机器风险评估市场
 2025 年至 2033 年机械安全市场报告(按实施、组件、最终用途行业和地区)
 机械安全市场-2025-2035年全球产业分析、规模、份额、成长、趋势及预测