


 |
市场调查报告书
商品编码
1664832
商用臭氧产生器市场机会、成长动力、产业趋势分析与预测 2025 - 2034Commercial Ozone Generator Market Opportunity, Growth Drivers, Industry Trend Analysis, and Forecast 2025 - 2034 |
||||||
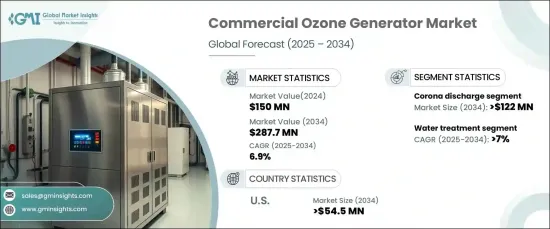
2024 年全球商用臭氧产生器市场价值 1.5 亿美元,预计 2025 年至 2034 年期间复合年增长率为 6.9%。这些系统利用电晕放电和紫外线等方法产生臭氧——一种强氧化剂。与家用设备相比,商用臭氧产生器的设计输出功率更高,通常包括自动控制、互联网介面和即时性能监控等先进功能。
政府和监管机构不断努力推广环保、无化学成分的消毒和净化解决方案,推动了臭氧发生器的普及。对维护办公室和工厂等商业空间清洁和安全的需求日益增加,从而推动了市场需求。此外,技术进步正在推动紧凑、高效、用户友好的臭氧系统的发展,该系统配备了自动化操作和即时监控等功能,进一步促进了它们的使用。
| 市场范围 | |
|---|---|
| 起始年份 | 2024 |
| 预测年份 | 2025-2034 |
| 起始值 | 1.5亿美元 |
| 预测值 | 2.877 亿美元 |
| 复合年增长率 | 6.9% |
食品加工产业越来越多地采用臭氧技术来消毒设备、控制微生物生长并延长产品保质期,这对市场成长产生了积极的影响。在技术方面,预计到 2034 年电晕放电领域的估值将超过 1.22 亿美元。持续的创新提高了系统可靠性、易用性和运作效率,使电晕放电技术在广泛的应用领域中更具吸引力。
预计水处理应用将经历强劲增长,到 2034 年复合年增长率将超过 7%。对水质标准的规定越来越严格,尤其是在市政水处理设施中,这推动了臭氧发生器的使用以满足合规要求。
在美国,商用臭氧产生器市场规模到 2034 年将超过 5,450 万美元。随着工业和城市发展的不断加快,人们越来越关注减少有害副产品和响应绿色倡议,这也增加了对有效的空气和水处理解决方案的需求,从而推动市场向前发展。
目录
第 1 章:方法论与范围
- 市场定义
- 基础估算与计算
- 预测计算
- 初步研究与验证
- 主要来源
- 资料探勘来源
- 市场定义
第 2 章:执行摘要
第 3 章:产业洞察
- 产业生态系统
- 监管格局
- 产业衝击力
- 成长动力
- 产业陷阱与挑战
- 成长潜力分析
- 波特的分析
- 供应商的议价能力
- 买家的议价能力
- 新进入者的威胁
- 替代品的威胁
- PESTEL 分析
第四章:竞争格局
- 介绍
- 战略仪表板
- 创新与技术格局
第 5 章:市场规模与预测:依技术,2021 – 2034 年
- 主要趋势
- 紫外线
- 冷等离子
- 电晕放电
- 电解
第 6 章:市场规模与预测:按应用,2021 – 2034 年
- 主要趋势
- 水处理
- 实验室和医疗设备
- 空气处理
- 其他的
第 7 章:市场规模及预测:依产能,2021 – 2034 年
- 主要趋势
- ≤ 5 克/小时
- 5 克/小时 - 100 克/小时
- 100 克/小时 - 1 公斤/小时
- 1 公斤/小时 - 5 公斤/小时
- > 5 公斤/小时
第 8 章:市场规模与预测:按地区,2021 – 2034 年
- 主要趋势
- 北美洲
- 我们
- 加拿大
- 欧洲
- 德国
- 英国
- 法国
- 俄罗斯
- 义大利
- 西班牙
- 亚太地区
- 中国
- 澳洲
- 印度
- 日本
- 韩国
- 中东和非洲
- 沙乌地阿拉伯
- 阿联酋
- 埃及
- 土耳其
- 南非
- 拉丁美洲
- 巴西
- 阿根廷
第九章:公司简介
- Corotec
- DEL Ozone
- EBARA Technologies
- Faraday Ozone
- Lenntech Water Treatment
- Oxidation Technologies
- ORAIPL
- Oxyzone
- Ozone Solutions
- Toshiba
The Global Commercial Ozone Generator Market was valued at USD 150 million in 2024 and is projected to grow at a CAGR of 6.9% from 2025 to 2034. These devices are engineered to generate ozone for extensive use in commercial environments. Using methods like corona discharge and ultraviolet light, these systems produce ozone, a potent oxidizing agent. Compared to residential units, commercial ozone generators are designed for higher output and often include advanced features such as automated controls, internet-enabled interfaces, and real-time performance monitoring.
Growing efforts by governments and regulatory bodies to promote eco-friendly and chemical-free solutions for disinfection and purification are driving the adoption of ozone generators. The increasing need for maintaining clean and safe commercial spaces, including offices and factories, is boosting market demand. Additionally, technological advancements are leading to the development of compact, efficient, and user-friendly ozone systems equipped with features like automated operations and real-time monitoring, further encouraging their use.
| Market Scope | |
|---|---|
| Start Year | 2024 |
| Forecast Year | 2025-2034 |
| Start Value | $150 Million |
| Forecast Value | $287.7 Million |
| CAGR | 6.9% |
The food processing sector is increasingly integrating ozone technology to sterilize equipment, control microbial growth, and enhance product shelf life, which is positively influencing market growth. In terms of technology, the corona discharge segment is expected to achieve a valuation exceeding USD 122 million by 2034. This growth is attributed to its ability to produce high concentrations of ozone with low energy consumption. Ongoing innovation to enhance system reliability, ease of use, and operational efficiency is making corona discharge technology more appealing across a broad spectrum of applications.
Water treatment applications are anticipated to experience robust growth, with a projected CAGR of over 7% through 2034. The superior oxidizing capabilities of ozone in removing bacteria, viruses, and organic pollutants make it a preferred alternative to traditional disinfectants like chlorine. Stricter regulations governing water quality standards, especially in municipal water treatment facilities, are fueling the adoption of ozone generators to meet compliance requirements.
In the United States, the commercial ozone generator market is set to surpass USD 54.5 million by 2034. Heightened enforcement of stringent air and water quality regulations, coupled with the rising demand for sustainable and environmentally friendly solutions, is driving product uptake. The growing focus on reducing harmful byproducts and aligning with green initiatives, along with increasing industrial and urban development, is amplifying the need for effective air and water treatment solutions, thereby propelling the market forward.
Table of Contents
Chapter 1 Methodology & Scope
- 1.1 Market definitions
- 1.2 Base estimates & calculations
- 1.3 Forecast calculation
- 1.4 Primary research & validation
- 1.4.1 Primary sources
- 1.4.2 Data mining sources
- 1.5 Market definitions
Chapter 2 Executive Summary
- 2.1 Industry synopsis, 2021 – 2034
Chapter 3 Industry Insights
- 3.1 Industry ecosystem
- 3.2 Regulatory landscape
- 3.3 Industry impact forces
- 3.3.1 Growth drivers
- 3.3.2 Industry pitfalls & challenges
- 3.4 Growth potential analysis
- 3.5 Porter's analysis
- 3.5.1 Bargaining power of suppliers
- 3.5.2 Bargaining power of buyers
- 3.5.3 Threat of new entrants
- 3.5.4 Threat of substitutes
- 3.6 PESTEL analysis
Chapter 4 Competitive landscape, 2024
- 4.1 Introduction
- 4.2 Strategic dashboard
- 4.3 Innovation & technology landscape
Chapter 5 Market Size and Forecast, By Technology, 2021 – 2034 (USD Million & Units)
- 5.1 Key trends
- 5.2 Ultraviolet
- 5.3 Cold plasma
- 5.4 Corona discharge
- 5.5 Electrolytic
Chapter 6 Market Size and Forecast, By Application, 2021 – 2034 (USD Million & Units)
- 6.1 Key trends
- 6.2 Water Treatment
- 6.3 Laboratory & medical equipment
- 6.4 Air Treatment
- 6.5 Others
Chapter 7 Market Size and Forecast, By Capacity, 2021 – 2034 (USD Million & Units)
- 7.1 Key trends
- 7.2 ≤ 5 gm/hr
- 7.3 5 gm/hr - 100 gm/hr
- 7.4 100 gm/hr - 1 kg/hr
- 7.5 1 kg/hr - 5 kg/hr
- 7.6 > 5 kg/hr
Chapter 8 Market Size and Forecast, By Region, 2021 – 2034 (USD Million & Units)
- 8.1 Key trends
- 8.2 North America
- 8.2.1 U.S.
- 8.2.2 Canada
- 8.3 Europe
- 8.3.1 Germany
- 8.3.2 UK
- 8.3.3 France
- 8.3.4 Russia
- 8.3.5 Italy
- 8.3.6 Spain
- 8.4 Asia Pacific
- 8.4.1 China
- 8.4.2 Australia
- 8.4.3 India
- 8.4.4 Japan
- 8.4.5 South Korea
- 8.5 Middle East & Africa
- 8.5.1 Saudi Arabia
- 8.5.2 UAE
- 8.5.3 Egypt
- 8.5.4 Turkey
- 8.5.5 South Africa
- 8.6 Latin America
- 8.6.1 Brazil
- 8.6.2 Argentina
Chapter 9 Company Profiles
- 9.1 Corotec
- 9.2 DEL Ozone
- 9.3 EBARA Technologies
- 9.4 Faraday Ozone
- 9.5 Lenntech Water Treatment
- 9.6 Oxidation Technologies
- 9.7 ORAIPL
- 9.8 Oxyzone
- 9.9 Ozone Solutions
- 9.10 Toshiba
 发电机市场:2026-2032年全球市场预测(按类型、便携性、控制系统、额定功率、最终用户产业、应用和销售管道)
 全球手摇发电机市场规模、份额、趋势和成长分析报告(2026-2034年)
 全球手摇发电机市场,2025-2029年多功能紧急电源车市场按燃料类型、额定功率、技术、出行性别、销售管道、应用和最终用户产业划分-全球预测(2026-2032 年)
 手摇发电机的全球市场
 轴带发电机系统市场-全球产业规模、份额、趋势、机会和预测,按类型、按应用(散装货船、货柜船、液化天然气船等)、按地区和竞争情况划分,2020 年至 2030 年预测紧急发电机市场-全球产业规模、份额、趋势、机会和预测(按容量、按最终用户、按燃料类型、按地区、按竞争进行细分,2020-2030 年预测)
 主发电机市场机会、成长动力、产业趋势分析及 2025 - 2034 年预测
 紧急发电机:市场占有率分析、产业趋势/统计、成长预测(2025-2030)