


 |
市场调查报告书
商品编码
1665019
可回收杯市场机会、成长动力、产业趋势分析及 2024 - 2032 年预测Recyclable Cups Market Opportunity, Growth Drivers, Industry Trend Analysis, and Forecast 2024 - 2032 |
||||||
2023 年全球可回收杯市场价值达到 295 亿美元,预计 2024 年至 2032 年期间复合年增长率为 5.7%。随着消费者对环保替代品的需求不断增加,回收技术的进步和饮料行业的扩张正在推动人们转向可回收杯子,与传统的一次性杯子相比,这是一种更可持续的选择。
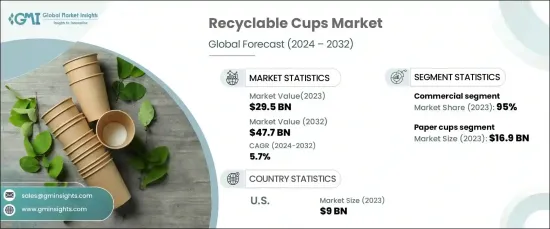
市场按材料类型细分,包括纸张、塑胶、金属、玻璃、竹纤维和其他可回收材料。纸杯产业在 2023 年以 169 亿美元的收入引领市场,预计到 2032 年将以 5.9% 的强劲复合年增长率增长。然而,传统纸杯通常带有聚乙烯衬里,面临回收挑战。这推动了可生物降解和完全可回收材料的创新,进一步推动了对更永续纸杯解决方案的需求。
| 市场范围 | |
|---|---|
| 起始年份 | 2023 |
| 预测年份 | 2024-2032 |
| 起始值 | 295亿美元 |
| 预测值 | 477亿美元 |
| 复合年增长率 | 5.7% |
可回收杯市场也按最终用户细分为住宅和商业应用,其中商业领域在 2023 年占据 95% 的主导份额。 预计该领域在 2024 年至 2032 年期间的复合年增长率为 5.7%。企业正在采用纸质、竹纤维和可回收塑胶杯,作为其永续发展和减少环境影响的承诺的一部分。
在美国,可回收杯市场在 2023 年创造了 90 亿美元的收入,预计到 2032 年的复合年增长率将达到 5.8%。随着永续性成为消费者的优先考虑因素,对由纸、竹子和植物材料製成的可堆肥和可重复使用的杯子的需求持续上升。限制一次性塑胶使用的监管措施进一步推动了环保替代品市场的发展。
目录
第 1 章:方法论与范围
- 市场范围和定义
- 基础估算与计算
- 预测计算。
- 资料来源
- 基本的
- 次要
- 付费来源
- 公共资源
第 2 章:执行摘要
第 3 章:产业洞察
- 产业生态系统分析
- 影响价值链的因素。
- 利润率分析。
- 中断
- 未来展望
- 製造商
- 经销商
- 供应商概况
- 利润率分析。
- 重要新闻及倡议
- 监管格局
- 衝击力
- 成长动力
- 增强环保意识
- 消费者对环保产品的需求
- 产业陷阱与挑战
- 其他环保替代品的竞争
- 来自传统塑胶的竞争
- 成长动力
- 消费者购买行为分析
- 成长潜力分析
- 波特的分析
- PESTEL 分析
第四章:竞争格局
- 介绍
- 公司市占率分析
- 竞争定位矩阵
- 战略展望矩阵
第 5 章:市场估计与预测:依材料类型,2021-2032 年
- 主要趋势
- 纸杯
- 涂层杯
- 无涂层杯子
- 塑胶杯
- 金属杯
- 玻璃杯
- 竹纤维杯
- 其他(复合杯、泡沫杯等)
第六章:市场估计与预测:依产能,2021-2032 年
- 主要趋势
- 最多 10 盎司
- 10至15盎司
- 15 盎司以上
第七章:市场估计与预测:按价格,2021-2032 年
- 主要趋势
- 低的
- 中等的
- 高的
第 8 章:市场估计与预测:按应用,2021 年至 2032 年
- 主要趋势
- 热饮
- 冷饮
第 9 章:市场估计与预测:按最终用途,2021-2032 年
- 主要趋势
- 住宅
- 商业的
- 食品和饮料
- 饭店和咖啡馆
- 接待和活动
- 其他(快餐店等)
第 10 章:市场估计与预测:按配销通路,2021-2032 年
- 主要趋势
- 直接销售
- 间接销售
第 11 章:市场估计与预测:按地区,2021-2032 年
- 主要趋势
- 北美洲
- 我们
- 加拿大
- 欧洲
- 英国
- 德国
- 法国
- 义大利
- 西班牙
- 俄罗斯
- 亚太地区
- 中国
- 印度
- 日本
- 韩国
- 澳洲
- 拉丁美洲
- 巴西
- 墨西哥
- 中东及非洲
- 阿联酋
- 沙乌地阿拉伯
- 南非
第 12 章:公司简介
- Ball
- Benders Paper Cups
- Berry Global
- BioCup
- Dart Container
- Detmold
- EcoSoul
- Georgia-Pacific
- Golden Paper Cups
- Green Paper Products
- Huhtamaki
- Nippon Paper
- Pactiv
- SogreenPack
- Solo Cup Company
The Global Recyclable Cups Market reached a value of USD 29.5 billion in 2023 and is projected to grow at a CAGR of 5.7% from 2024 to 2032. Rising environmental awareness, stricter regulations, and corporate sustainability efforts are key factors propelling the growth of this market. As consumers increasingly demand eco-friendly alternatives, advancements in recycling technologies and the expansion of the beverage industry are fueling the shift toward recyclable cups as a more sustainable option compared to traditional disposable cups.
The market is segmented by material type, including paper, plastic, metal, glass, bamboo fiber, and other recyclable materials. The paper cup segment led the market in 2023 with a revenue of USD 16.9 billion and is expected to grow at a robust CAGR of 5.9% through 2032. The increasing restrictions on plastic use and growing environmental concerns are making paper cups the preferred choice. However, traditional paper cups, which often feature polyethylene linings, face recycling challenges. This has driven innovation in biodegradable and fully recyclable materials, further propelling the demand for more sustainable paper cup solutions.
| Market Scope | |
|---|---|
| Start Year | 2023 |
| Forecast Year | 2024-2032 |
| Start Value | $29.5 Billion |
| Forecast Value | $47.7 Billion |
| CAGR | 5.7% |
The recyclable cups market is also segmented by end-users into residential and commercial applications, with the commercial segment accounting for a dominant 95% share in 2023. This segment is expected to grow at a CAGR of 5.7% between 2024 and 2032. The growing bans on single-use plastics in sectors such as hospitality, food services, and events have accelerated the shift toward recyclable and reusable options. Businesses are adopting paper, bamboo fiber, and recyclable plastic cups as part of their commitment to sustainability and reducing environmental impact.
In the U.S., the recyclable cups market generated USD 9 billion in revenue in 2023 and is expected to experience a CAGR of 5.8% through 2032. The growth of this market is driven by heightened eco-consciousness among consumers, evolving government policies, increased demand within the food service industry, and improvements in recycling infrastructure. As sustainability becomes a priority for consumers, the demand for compostable and reusable cups made from paper, bamboo, and plant-based materials continues to rise. Regulatory measures that curb the use of single-use plastics are further propelling the market for eco-friendly alternatives.
Table of Contents
Chapter 1 Methodology & Scope
- 1.1 Market scope & definitions
- 1.2 Base estimates & calculations
- 1.3 Forecast calculations.
- 1.4 Data sources
- 1.4.1 Primary
- 1.4.2 Secondary
- 1.4.2.1 Paid sources
- 1.4.2.2 Public sources
Chapter 2 Executive Summary
- 2.1 Industry synopsis, 2021-2032
Chapter 3 Industry Insights
- 3.1 Industry ecosystem analysis
- 3.1.1 Factor affecting the value chain.
- 3.1.2 Profit margin analysis.
- 3.1.3 Disruptions
- 3.1.4 Future outlook
- 3.1.5 Manufacturers
- 3.1.6 Distributors
- 3.2 Supplier landscape
- 3.3 Profit margin analysis.
- 3.4 Key news & initiatives
- 3.5 Regulatory landscape
- 3.6 Impact forces
- 3.6.1 Growth drivers
- 3.6.1.1 Increased environmental awareness
- 3.6.1.2 Consumer demand for eco-friendly products
- 3.6.2 Industry pitfalls & challenges
- 3.6.2.1 Competition from other eco-friendly alternatives
- 3.6.2.2 Competition from traditional plastics
- 3.6.1 Growth drivers
- 3.7 Consumer buying behavior analysis
- 3.8 Growth potential analysis
- 3.9 Porter’s analysis
- 3.10 PESTEL analysis
Chapter 4 Competitive Landscape, 2023
- 4.1 Introduction
- 4.2 Company market share analysis
- 4.3 Competitive positioning matrix
- 4.4 Strategic outlook matrix
Chapter 5 Market Estimates & Forecast, By Material Type, 2021-2032 (USD Billion) (Million Units)
- 5.1 Key trends
- 5.2 Paper cups
- 5.2.1 Coated cups
- 5.2.2 Non-coated cups
- 5.3 Plastic cups
- 5.4 Metal cups
- 5.5 Glass cups
- 5.6 Bamboo fiber cups
- 5.7 Others (composite cups, foam cups, etc.)
Chapter 6 Market Estimates & Forecast, By Capacity, 2021-2032 (USD Billion) (Million Units)
- 6.1 Key trends
- 6.2 Up to 10 oz
- 6.3 10 to 15 oz
- 6.4 Above 15 oz
Chapter 7 Market Estimates & Forecast, By Price, 2021-2032 (USD Billion) (Million Units)
- 7.1 Key trends
- 7.2 Low
- 7.3 Medium
- 7.4 High
Chapter 8 Market Estimates & Forecast, By Application, 2021-2032 (USD Billion) (Million Units)
- 8.1 Key trends
- 8.2 Hot beverages
- 8.3 Cold beverages
Chapter 9 Market Estimates & Forecast, By End Use, 2021-2032 (USD Billion) (Million Units)
- 9.1 Key trends
- 9.2 Residential
- 9.3 Commercial
- 9.3.1 Food & beverage
- 9.3.2 Hotels and cafes
- 9.3.3 Hospitality and events
- 9.3.4 Others (quick-service restaurants etc.)
Chapter 10 Market Estimates & Forecast, By Distribution Channel, 2021-2032 (USD Billion) (Million Units)
- 10.1 Key trends
- 10.2 Direct sales
- 10.3 Indirect sales
Chapter 11 Market Estimates & Forecast, By Region, 2021-2032 (USD Billion) (Million Units)
- 11.1 Key trends
- 11.2 North America
- 11.2.1 U.S.
- 11.2.2 Canada
- 11.3 Europe
- 11.3.1 UK
- 11.3.2 Germany
- 11.3.3 France
- 11.3.4 Italy
- 11.3.5 Spain
- 11.3.6 Russia
- 11.4 Asia Pacific
- 11.4.1 China
- 11.4.2 India
- 11.4.3 Japan
- 11.4.4 South Korea
- 11.4.5 Australia
- 11.5 Latin America
- 11.5.1 Brazil
- 11.5.2 Mexico
- 11.6 MEA
- 11.6.1 UAE
- 11.6.2 Saudi Arabia
- 11.6.3 South Africa
Chapter 12 Company Profiles
- 12.1 Ball
- 12.2 Benders Paper Cups
- 12.3 Berry Global
- 12.4 BioCup
- 12.5 Dart Container
- 12.6 Detmold
- 12.7 EcoSoul
- 12.8 Georgia-Pacific
- 12.9 Golden Paper Cups
- 12.10 Green Paper Products
- 12.11 Huhtamaki
- 12.12 Nippon Paper
- 12.13 Pactiv
- 12.14 SogreenPack
- 12.15 Solo Cup Company
 一次性杯子市场规模、产品类型、材料类型、最终用户、分销管道和应用—2025-2032 年全球预测
 2025年全球杯子和杯盖市场报告2025年全球杯子和盖子包装市场报告
 全球一次性杯子市场研究报告-产业分析、规模、份额、成长、趋势及2025年至2033年预测
 全球杯子与杯盖市场全球一次性杯子市场
 杯子和杯盖市场规模、份额、成长分析(按原料、产品、应用和地区)- 产业预测,2025 年至 2032 年全球泡沫杯市场研究报告-产业分析、规模、份额、成长、趋势及2025年至2033年预测全球发泡杯市场2025年全球便携式杯市场报告