


 |
市场调查报告书
商品编码
1665083
智慧奈米建筑材料市场机会、成长动力、产业趋势分析及 2024 - 2032 年预测Smart Nano-Construction Materials Market Opportunity, Growth Drivers, Industry Trend Analysis, and Forecast 2024 - 2032 |
||||||
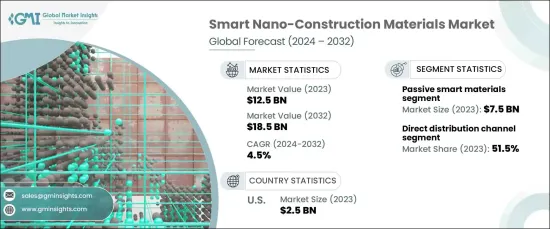
2023 年全球智慧奈米建筑材料市场估值达到 125 亿美元,预计 2024 年至 2032 年期间的复合年增长率为 4.5%。这些创新具有自我修復能力、增强的耐用性和更好的隔热性等优势,所有这些都提高了建筑项目的寿命和性能。随着这些材料变得越来越复杂,它们不仅提高了建筑标准,而且还满足了对节能和环境永续建筑解决方案日益增长的需求。这种转变符合全球永续发展目标,因为这些先进的材料可以帮助减少能源消耗并降低现代建筑对环境的影响。
绿色节能建筑的需求加速了智慧奈米建筑材料的采用。这些材料越来越受到青睐,因为它们能够提高建筑物的能源效率和结构完整性,有助于大幅降低能源成本和排放。智慧奈米建筑材料在塑造建筑业的未来方面发挥着至关重要的作用,有助于实现永续发展目标,同时确保建筑物在更长的时间内保持耐用性和功能性。
| 市场范围 | |
|---|---|
| 起始年份 | 2023 |
| 预测年份 | 2024-2032 |
| 起始值 | 125亿美元 |
| 预测值 | 185亿美元 |
| 复合年增长率 | 4.5% |
就材料类型而言,市场分为两个主要部分:主动智慧材料和被动智慧材料。 2023 年,被动智慧材料占据市场主导地位,价值达 75 亿美元。预计该部分在预测期内的复合年增长率为 4.2%。自修復混凝土和隔热奈米复合材料等被动智慧材料无需外部控制系统即可自主提高建筑物的性能。
这些材料的分销管道也在不断发展,人们明显倾向于直接分销方式。 2023 年,直接配销通路占据了 51.5% 的市场份额,预计 2024 年至 2032 年期间的复合年增长率为 4.6%。此外,它还能确保专业产品及时进入市场,进而提高整体市场的覆盖率和渗透率。
美国智慧奈米建筑材料市场在 2023 年的价值为 25 亿美元,预计在 2024 年至 2032 年期间的复合年增长率为 4.6%。政府支持绿色建筑实践的倡议进一步推动了美国采用智慧奈米建筑材料,加强了国家对创造永续和耐用建筑的承诺。
目录
第 1 章:方法论与范围
- 市场范围和定义
- 基础估算与计算
- 预测参数
- 资料来源
- 基本的
- 次要
- 付费来源
- 公共资源
第 2 章:执行摘要
第 3 章:产业洞察
- 产业生态系统分析
- 影响价值链的因素
- 利润率分析
- 中断
- 未来展望
- 製造商
- 经销商
- 供应商概况
- 利润率分析
- 重要新闻及倡议
- 监管格局
- 技术格局
- 衝击力
- 成长动力
- 奈米科技的进步
- 绿建筑需求不断成长
- 加强基础建设
- 增强材料性能和耐用性
- 产业陷阱与挑战
- 生产成本高
- 认知和采用有限
- 成长动力
- 成长潜力分析
- 波特的分析
- PESTEL 分析
第四章:竞争格局
- 介绍
- 公司市占率分析
- 竞争定位矩阵
- 战略展望矩阵
第 5 章:市场估计与预测:按材料类型,2021 年至 2032 年
- 主要趋势
- 智慧奈米混凝土
- 智慧奈米涂层
- 智慧奈米玻璃
- 其他(奈米绝缘材料、添加剂等)
第六章:市场估计与预测:依技术类型,2021 – 2032 年
- 主要趋势
- 活性智慧材料
- 被动智慧材料
第 7 章:市场估计与预测:按应用,2021 年至 2032 年
- 主要趋势
- 结构应用
- 非结构性应用
- 监控系统
第 8 章:市场估计与预测:依最终用途,2021 年至 2032 年
- 主要趋势
- 商业建筑
- 住宅建筑
- 基础设施
- 工业的
第 9 章:市场估计与预测:按配销通路,2021 年至 2032 年
- 主要趋势
- 直接的
- 间接
第 10 章:市场估计与预测:按地区,2021 年至 2032 年
- 主要趋势
- 北美洲
- 我们
- 加拿大
- 欧洲
- 英国
- 德国
- 法国
- 义大利
- 西班牙
- 亚太地区
- 中国
- 日本
- 印度
- 澳洲
- 拉丁美洲
- 巴西
- 墨西哥
- 中东及非洲
- 南非
- 沙乌地阿拉伯
- 阿联酋
第 11 章:公司简介
- 3M Company
- Advenira Enterprises, Inc.
- Aerogel Technologies, LLC
- AkzoNobel NV
- Arkema
- BASF SE
- Cabot Corporation
- Dupont
- Evonik Industries AG
- Haliburton Company
- Nanogate SE
- Nanophase Technologies Corporation
- NanoPore Incorporated
- Saint-Gobain
- XG Sciences, Inc.
The Global Smart Nano-Construction Materials Market reached a valuation of USD 12.5 billion in 2023 and is expected to grow at a CAGR of 4.5% from 2024 to 2032. This growth is primarily driven by rapid advancements in nanotechnology, which have led to the development of materials with exceptional properties. These innovations offer benefits like self-healing capabilities, enhanced durability, and better thermal insulation, all of which improve the longevity and performance of construction projects. As these materials become more sophisticated, they not only elevate building standards but also cater to the growing demand for energy-efficient and environmentally sustainable construction solutions. This shift aligns with global sustainability goals, as these advanced materials can help reduce energy consumption and lower the environmental footprint of modern buildings.
The demand for green, energy-efficient buildings has accelerated the adoption of smart nano-construction materials. These materials are increasingly favored due to their ability to enhance the energy efficiency and structural integrity of buildings, which contributes to substantial reductions in energy costs and emissions. Smart nano-construction materials play a crucial role in shaping the future of the construction industry, helping to meet sustainability goals while ensuring that buildings remain durable and functional for longer periods.
| Market Scope | |
|---|---|
| Start Year | 2023 |
| Forecast Year | 2024-2032 |
| Start Value | $12.5 Billion |
| Forecast Value | $18.5 Billion |
| CAGR | 4.5% |
Regarding material types, the market is divided into two key segments: active and passive smart materials. In 2023, passive smart materials dominated the market, holding a value of USD 7.5 billion. This segment is projected to expand at a CAGR of 4.2% through the forecast period. Passive smart materials, such as self-healing concrete and thermal insulation nanocomposites, autonomously enhance the performance of buildings without the need for external control systems.
The distribution channels for these materials are also evolving, with a notable preference for direct distribution methods. In 2023, the direct distribution channel held a 51.5% share of the market and is anticipated to grow at a CAGR of 4.6% from 2024 to 2032. Direct distribution allows manufacturers to establish a direct connection with end-users, helping to reduce costs and improve customer service. Additionally, it ensures that specialized products reach the market promptly, which boosts overall market reach and penetration.
The U.S. market for smart nano-construction materials, valued at USD 2.5 billion in 2023, is projected to grow at a CAGR of 4.6% from 2024 to 2032. Factors such as substantial investments in sustainable infrastructure, advanced construction technologies, and a focus on energy-efficient materials are driving this growth. Government initiatives supporting green building practices further propel the adoption of smart nano-construction materials in the U.S., reinforcing the nation's commitment to creating sustainable and durable buildings.
Table of Contents
Chapter 1 Methodology & Scope
- 1.1 Market scope & definition
- 1.2 Base estimates & calculations
- 1.3 Forecast parameters
- 1.4 Data sources
- 1.4.1 Primary
- 1.5 Secondary
- 1.5.1.1 Paid sources
- 1.5.1.2 Public sources
Chapter 2 Executive Summary
- 2.1 Industry synopsis, 2021 - 2032
Chapter 3 Industry Insights
- 3.1 Industry ecosystem analysis
- 3.1.1 Factor affecting the value chain
- 3.1.2 Profit margin analysis
- 3.1.3 Disruptions
- 3.1.4 Future outlook
- 3.1.5 Manufacturers
- 3.1.6 Distributors
- 3.2 Supplier landscape
- 3.3 Profit margin analysis
- 3.4 Key news & initiatives
- 3.5 Regulatory landscape
- 3.6 Technological landscape
- 3.7 Impact forces
- 3.7.1 Growth drivers
- 3.7.1.1 Advancements in nanotechnology
- 3.7.1.2 Rising demand for green buildings
- 3.7.1.3 Increased infrastructure development
- 3.7.1.4 Enhanced material performance and durability
- 3.7.2 Industry pitfalls & challenges
- 3.7.2.1 High production costs
- 3.7.2.2 Limited awareness and adoption
- 3.7.1 Growth drivers
- 3.8 Growth potential analysis
- 3.9 Porter’s analysis
- 3.10 PESTEL analysis
Chapter 4 Competitive Landscape, 2023
- 4.1 Introduction
- 4.2 Company market share analysis
- 4.3 Competitive positioning matrix
- 4.4 Strategic outlook matrix
Chapter 5 Market Estimates and Forecast, By Material Type, 2021 – 2032 (USD Billion) (Tons)
- 5.1 Key trends
- 5.2 Smart nano concrete
- 5.3 Smart nano coatings
- 5.4 Smart nano glass
- 5.5 Others (nano-insulation materials, additives, etc.)
Chapter 6 Market Estimates and Forecast, By Technology Type, 2021 – 2032 (USD Billion) (Tons)
- 6.1 Key trends
- 6.2 Active smart materials
- 6.3 Passive smart materials
Chapter 7 Market Estimates and Forecast, By Application, 2021 – 2032 (USD Billion) (Tons)
- 7.1 Key trends
- 7.2 Structural applications
- 7.3 Non-structural applications
- 7.4 Monitoring systems
Chapter 8 Market Estimates and Forecast, By End Use, 2021 – 2032 (USD Billion) (Tons)
- 8.1 Key trends
- 8.2 Commercial buildings
- 8.3 Residential buildings
- 8.4 Infrastructure
- 8.5 Industrial
Chapter 9 Market Estimates & Forecast, By Distribution Channel, 2021 – 2032, (USD Billion) (Tons)
- 9.1 Key trends
- 9.2 Direct
- 9.3 Indirect
Chapter 10 Market Estimates & Forecast, By Region, 2021 – 2032, (USD Billion) (Tons)
- 10.1 Key trends
- 10.2 North America
- 10.2.1 U.S.
- 10.2.2 Canada
- 10.3 Europe
- 10.3.1 UK
- 10.3.2 Germany
- 10.3.3 France
- 10.3.4 Italy
- 10.3.5 Spain
- 10.4 Asia Pacific
- 10.4.1 China
- 10.4.2 Japan
- 10.4.3 India
- 10.4.4 Australia
- 10.5 Latin America
- 10.5.1 Brazil
- 10.5.2 Mexico
- 10.6 MEA
- 10.6.1 South Africa
- 10.6.2 Saudi Arabia
- 10.6.3 UAE
Chapter 11 Company Profiles (Business Overview, Financial Data, Product Landscape, Strategic Outlook, SWOT Analysis)
- 11.1 3M Company
- 11.2 Advenira Enterprises, Inc.
- 11.3 Aerogel Technologies, LLC
- 11.4 AkzoNobel N.V.
- 11.5 Arkema
- 11.6 BASF SE
- 11.7 Cabot Corporation
- 11.8 Dupont
- 11.9 Evonik Industries AG
- 11.10 Haliburton Company
- 11.11 Nanogate SE
- 11.12 Nanophase Technologies Corporation
- 11.13 NanoPore Incorporated
- 11.14 Saint-Gobain
- 11.15 XG Sciences, Inc.
 全球微孔材料市场
 2032 年奈米钻石市场预测:按类型、等级、形状、应用、最终用户和地区进行的全球分析
 奈米材料市场规模、份额、趋势及预测(按产品类型、结构类型、最终用途产业和地区),2025 年至 2033 年
 智慧奈米建筑材料市场,按材料、按应用、按技术、按最终用途、按配销通路、按国家和地区 - 2025 年至 2032 年全球行业分析、市场规模、市场份额和预测
 全球埃洛石市场类型、结构、形式、应用和分销管道预测(2025-2030 年)微孔材料市场报告:2031 年趋势、预测与竞争分析奈米钻石市场规模、份额、趋势分析报告:按产品、最终用途、地区、细分市场预测,2025-2030奈米分散产品市场报告:趋势、预测和竞争分析(至 2031 年)全球埃洛石市场按类型、应用和地区划分奈米银市场,按合成方法、按最终用户、按国家和地区划分 - 2025 年至 2032 年全球行业分析、市场规模、市场份额和预测