


 |
市场调查报告书
商品编码
1665101
推拉工具市场机会、成长动力、产业趋势分析与 2024 - 2032 年预测Push Pull Tools Market Opportunity, Growth Drivers, Industry Trend Analysis, and Forecast 2024 - 2032 |
||||||
2023 年全球推拉工具市场价值为 11.4 亿美元,预计 2024 年至 2032 年期间将以 4.2% 的复合年增长率稳步增长。这些工具被广泛认为可以提高生产力、减少身体劳损并改善工作场所的安全性。随着製造技术的进步和对营运效率的日益重视,对推拉工具的需求正在不断扩大。由于安全标准和监管要求的不断提高以及对人体工学设计的重视,它们在製造、建筑、物流和汽车等领域发挥着至关重要的作用。随着全球工业活动不断增加,在技术创新和工业基础设施不断发展的推动下,该市场将实现大幅成长。
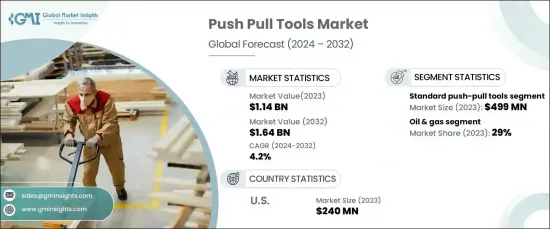
2023 年,标准推拉工具部门的收入为 4.99 亿美元,预计在预测期内的复合年增长率为 4.4%。这些工具对于製造业和建筑业等行业至关重要,因为它们简化材料处理和组装流程的能力至关重要。标准推拉工具可显着减轻工人的压力并提高生产效率,这是注重改善人体工学和安全性的行业的关键因素。随着製造业和建筑业的持续成长,对这些工具的需求预计会增加,确保市场持续扩大。
| 市场范围 | |
|---|---|
| 起始年份 | 2023 |
| 预测年份 | 2024-2032 |
| 起始值 | 11.4亿美元 |
| 预测值 | 16.4亿美元 |
| 复合年增长率 | 4.2% |
石油和天然气行业在 2023 年占据了 29% 的市场份额,预计在 2024 年至 2032 年期间的复合年增长率为 4.5%。它们在防止设备故障和减少停机时间方面发挥的作用对于延长关键资产的使用寿命至关重要。随着对基础设施、勘探活动和维护作业的大量投资,石油和天然气行业对推拉工具的需求预计将大幅上升。
在美国,推拉工具市场在 2023 年的价值为 2.4 亿美元,预计到 2032 年将以 4.3% 的复合年增长率成长。重视安全性、营运效率和精确度的产业正在推动推拉工具的采用,主要应用包括材料处理、组件对准和设备安装。这些行业的成长,加上技术的进步,预计将推动对推拉工具的持续需求。
目录
第 1 章:方法论与范围
- 市场范围和定义
- 基础估算与计算
- 预测计算。
- 资料来源
- 基本的
- 次要
- 付费来源
- 公共资源
第 2 章:执行摘要
第 3 章:产业洞察
- 产业生态系统分析
- 影响价值链的因素
- 利润率分析
- 中断
- 未来展望
- 製造商
- 经销商
- 供应商概况
- 利润率分析。
- 重要新闻及倡议
- 监管格局
- 衝击力
- 成长动力
- 工业自动化需求不断成长
- 高效率物料搬运的需求日益增加
- 产业陷阱与挑战
- 缺乏意识和培训
- 成长动力
- 成长潜力分析
- 波特的分析
- PESTEL 分析
第四章:竞争格局
- 介绍
- 公司市占率分析
- 竞争定位矩阵
- 战略展望矩阵
第 5 章:市场估计与预测:按工具类型,2021 年至 2032 年
- 主要趋势
- 标准推拉工具
- 直推拉工具
- 可调式推拉工具
- 重型推拉工具
- 液压推拉工具
- 气动推拉工具
- 旋转推拉工具
- 旋转头工具
- 枢轴头工具
- 磁性推拉工具
- 固定磁性工具
- 可调磁性工具
- 其他(人体工学推拉工具等)
第六章:市场估计与预测:按负载能力,2021-2032 年
- 主要趋势
- 最多 50 公斤
- 50–200 公斤
- 200公斤以上
第 7 章:市场估计与预测:按应用,2021 年至 2032 年
- 主要趋势
- 物料处理
- 对齐任务
- 检查和维护
- 其他(紧急行动等)
第 8 章:市场估计与预测:依最终用途,2021-2032 年
- 主要趋势
- 石油和天然气
- 建造
- 製造业
- 矿业
- 其他(物流等)
第 9 章:市场估计与预测:按配销通路,2021-2032 年
- 主要趋势
- 直接的
- 间接
第 10 章:市场估计与预测:按地区,2021-2032 年
- 主要趋势
- 北美洲
- 我们
- 加拿大
- 欧洲
- 英国
- 德国
- 法国
- 义大利
- 西班牙
- 俄罗斯
- 亚太地区
- 中国
- 印度
- 日本
- 韩国
- 澳洲
- 拉丁美洲
- 巴西
- 墨西哥
- 中东及非洲
- 阿联酋
- 沙乌地阿拉伯
- 南非
第 11 章:公司简介
- Enerpac Tool Group
- Hydratight
- Schroeder Industries
- SPX Flow, Inc.
- Master Pull, LLC
- Graco Inc.
- Stanley Black & Decker, Inc.
- Grote Industries, Inc.
- Tuthill Corporation
- WIKA Instruments Ltd.
- Lindapter International Ltd.
- Cleveland Cable Company
- Ridge Tool Company
- Hilti Corporation
- Jergens, Inc.
The Global Push Pull Tools Market, valued at USD 1.14 billion in 2023, is expected to grow steadily at a CAGR of 4.2% from 2024 to 2032. As industries increasingly demand efficient movement, precise alignment, and careful positioning of heavy materials, the role of push-pull tools becomes indispensable in operations across various sectors. These tools are widely recognized for enhancing productivity, reducing physical strain, and improving safety in the workplace. With advancements in manufacturing technologies and a growing emphasis on operational efficiency, demand for push-pull tools is expanding. Their crucial role in sectors like manufacturing, construction, logistics, and automotive is further bolstered by rising safety standards, regulatory requirements, and a focus on ergonomic designs. As industrial activities continue to increase globally, this market is poised for significant growth, driven by technological innovations and the continuous development of industrial infrastructure.
In 2023, the standard push-pull tools segment garnered USD 499 million in revenue and is projected to expand at a CAGR of 4.4% during the forecast period. These tools are essential in industries such as manufacturing and construction, where their capacity to streamline material handling and assembly processes is paramount. Standard push-pull tools significantly reduce worker strain while enhancing productivity, a key factor in industries focused on improving ergonomics and safety. The demand for these tools is expected to rise as manufacturing and construction industries continue to experience growth, ensuring consistent market expansion.
| Market Scope | |
|---|---|
| Start Year | 2023 |
| Forecast Year | 2024-2032 |
| Start Value | $1.14 Billion |
| Forecast Value | $1.64 Billion |
| CAGR | 4.2% |
The oil and gas sector accounted for 29% of the market share in 2023 and is projected to grow at a CAGR of 4.5% between 2024 and 2032. In this sector, push-pull tools are crucial for handling complex equipment and materials during maintenance and inspections, ensuring proper alignment and secure positioning. Their role in preventing equipment failures and minimizing downtime is vital to prolonging the lifespan of critical assets. With substantial investments in infrastructure, exploration activities, and maintenance operations, the demand for push-pull tools in the oil and gas industry is expected to rise significantly.
In the U.S., the push-pull tools market was valued at USD 240 million in 2023 and is forecasted to grow at a CAGR of 4.3% through 2032. With its advanced industrial landscape, the U.S. sees significant demand from its manufacturing and construction sectors. Industries that prioritize safety, operational efficiency, and precision are driving the adoption of push-pull tools, with key applications including material handling, component alignment, and equipment installation. The growth of these sectors, coupled with advancements in technology, is expected to fuel sustained demand for push-pull tools.
Table of Contents
Chapter 1 Methodology & Scope
- 1.1 Market scope & definitions
- 1.2 Base estimates & calculations
- 1.3 Forecast calculations.
- 1.4 Data sources
- 1.4.1 Primary
- 1.4.2 Secondary
- 1.4.2.1 Paid sources
- 1.4.2.2 Public sources
Chapter 2 Executive Summary
- 2.1 Industry synopsis, 2021-2032
Chapter 3 Industry Insights
- 3.1 Industry ecosystem analysis
- 3.1.1 Factor affecting the value chain
- 3.1.2 Profit margin analysis
- 3.1.3 Disruptions
- 3.1.4 Future outlook
- 3.1.5 Manufacturers
- 3.1.6 Distributors
- 3.2 Supplier landscape
- 3.3 Profit margin analysis.
- 3.4 Key news & initiatives
- 3.5 Regulatory landscape
- 3.6 Impact forces
- 3.6.1 Growth drivers
- 3.6.1.1 Increasing demand for industrial automation
- 3.6.1.2 Rising need for efficient material handling
- 3.6.2 Industry pitfalls & challenges
- 3.6.2.1 Lack of awareness and training
- 3.6.1 Growth drivers
- 3.7 Growth potential analysis
- 3.8 Porter’s analysis
- 3.9 PESTEL analysis
Chapter 4 Competitive Landscape, 2023
- 4.1 Introduction
- 4.2 Company market share analysis
- 4.3 Competitive positioning matrix
- 4.4 Strategic outlook matrix
Chapter 5 Market Estimates & Forecast, By Tool Type, 2021-2032 (USD Million) (Million Units)
- 5.1 Key trends
- 5.2 Standard Push-Pull tools
- 5.2.1 Straight Push-Pull tools
- 5.2.2 Adjustable Push-Pull tools
- 5.3 Heavy-Duty Push-Pull tools
- 5.3.1 Hydraulic Push-Pull tools
- 5.3.2 Pneumatic Push-Pull tools
- 5.4 Rotational Push-Pull tools
- 5.4.1 Swivel-Head tools
- 5.4.2 Pivot-Head tools
- 5.5 Magnetic Push-Pull tools
- 5.5.1 Fixed Magnetic tools
- 5.5.2 Adjustable Magnetic tools
- 5.6 Others (Ergonomic Push-Pull tools, Etc)
Chapter 6 Market Estimates & Forecast, By Load Capacity, 2021-2032 (USD Million) (Million Units)
- 6.1 Key trends
- 6.2 Up to 50 kg
- 6.3 50–200 kg
- 6.4 Above 200 kg
Chapter 7 Market Estimates & Forecast, By Application, 2021-2032 (USD Million) (Million Units)
- 7.1 Key trends
- 7.2 Material handling
- 7.3 Alignment tasks
- 7.4 Inspection and maintenance
- 7.5 Others (emergency operations, Etc.)
Chapter 8 Market Estimates & Forecast, By End-use, 2021-2032 (USD Million) (Million Units)
- 8.1 Key trends
- 8.2 Oil & gas
- 8.3 Construction
- 8.4 Manufacturing
- 8.5 Mining
- 8.6 Others (Logistics, Etc)
Chapter 9 Market Estimates & Forecast, By Distribution Channel, 2021-2032 (USD Million) (Million Units)
- 9.1 Key trends
- 9.2 Direct
- 9.3 Indirect
Chapter 10 Market Estimates & Forecast, By Region, 2021-2032 (USD Million) (Million Units)
- 10.1 Key trends
- 10.2 North America
- 10.2.1 U.S.
- 10.2.2 Canada
- 10.3 Europe
- 10.3.1 UK
- 10.3.2 Germany
- 10.3.3 France
- 10.3.4 Italy
- 10.3.5 Spain
- 10.3.6 Russia
- 10.4 Asia Pacific
- 10.4.1 China
- 10.4.2 India
- 10.4.3 Japan
- 10.4.4 South Korea
- 10.4.5 Australia
- 10.5 Latin America
- 10.5.1 Brazil
- 10.5.2 Mexico
- 10.6 MEA
- 10.6.1 UAE
- 10.6.2 Saudi Arabia
- 10.6.3 South Africa
Chapter 11 Company Profiles
- 11.1 Enerpac Tool Group
- 11.2 Hydratight
- 11.3 Schroeder Industries
- 11.4 SPX Flow, Inc.
- 11.5 Master Pull, LLC
- 11.6 Graco Inc.
- 11.7 Stanley Black & Decker, Inc.
- 11.8 Grote Industries, Inc.
- 11.9 Tuthill Corporation
- 11.10 WIKA Instruments Ltd.
- 11.11 Lindapter International Ltd.
- 11.12 Cleveland Cable Company
- 11.13 Ridge Tool Company
- 11.14 Hilti Corporation
- 11.15 Jergens, Inc.