


 |
市场调查报告书
商品编码
1665256
光谱软体市场机会、成长动力、产业趋势分析与预测 2025 - 2034Spectroscopy Software Market Opportunity, Growth Drivers, Industry Trend Analysis, and Forecast 2025 - 2034 |
||||||
2024 年全球光谱软体市场价值为 11 亿美元,预计 2025 年至 2034 年期间复合年增长率将达到 9.1% 。该软体对于依赖精确测量的行业至关重要,使其成为各个领域的关键工具。
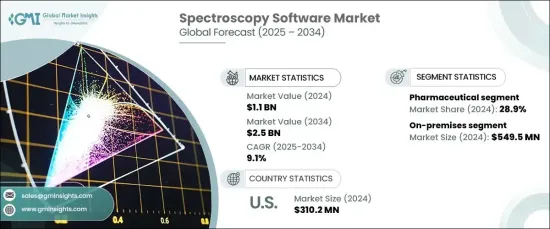
根据部署类型,市场分为内部部署和基于云端的解决方案。 2024 年,内部部署部门引领市场,创造 5.495 亿美元的收入,预计在整个预测期内将继续保持强劲成长。本地解决方案尤其受到需要加强对敏感资料控制的组织的青睐,这对于遵守产业法规至关重要。医疗保健和製药等行业都非常重视资料安全,因此强烈倾向于内部部署模式。这些解决方案确保了必要的安全性和资讯控制,使其成为满足严格的监管标准不可或缺的一部分。
| 市场范围 | |
|---|---|
| 起始年份 | 2024 |
| 预测年份 | 2025-2034 |
| 起始值 | 11亿美元 |
| 预测值 | 25亿美元 |
| 复合年增长率 | 9.1% |
从应用方面来看,市场分为食品检测、环境检测、法医科学、製药和其他领域。 2024 年,製药业占据了 28.9% 的市场份额,预计未来几年将大幅成长。药物开发对精度和高品质标准的要求不断增加,以及监管要求日益严格,推动了光谱软体的广泛应用。此外,药物研发中对高通量筛选的不断增长的需求也推动了这些软体解决方案的使用。研究人员越来越依赖光谱软体来管理大型数据集、简化工作流程并加速药物开发和临床测试的研究成果。
在美国,光谱软体市场在 2024 年创造了 3.102 亿美元的收入。美国实验室广泛采用先进的分析技术,再加上製药和食品安全等行业的严格监管环境,持续推动对尖端光谱软体解决方案的需求。这些因素加上持续的技术进步,预计将维持美国市场的成长并促进未来十年的持续扩张。
目录
第 1 章:方法论与范围
- 市场范围和定义
- 研究设计
- 研究方法
- 资料收集方法
- 基础估算与计算
- 基准年计算
- 市场估计的主要趋势
- 预测模型
- 初步研究和验证
- 主要来源
- 资料探勘来源
第 2 章:执行摘要
第 3 章:产业洞察
- 产业生态系统分析
- 产业衝击力
- 成长动力
- 製药业对光谱软体的需求不断增长
- 环境与食品安全法规
- 技术进步
- 学术和研究机构的研发投资增加
- 产业陷阱与挑战
- 资料安全问题
- 成长动力
- 成长潜力分析
- 监管格局
- 我们
- 欧洲
- 技术格局
- 未来市场趋势
- 重要新闻和倡议
- 差距分析
- 波特的分析
- PESTEL 分析
第四章:竞争格局
- 介绍
- 公司市占率分析
- 公司矩阵分析
- 主要市场参与者的竞争分析
- 竞争定位矩阵
- 策略仪表板
第 5 章:市场估计与预测:按部署类型,2021 年至 2034 年
- 主要趋势
- 本地
- 云
第 6 章:市场估计与预测:按应用,2021 年至 2034 年
- 主要趋势
- 食品检测
- 环境测试
- 法医学
- 药品
- 其他应用
第 7 章:市场估计与预测:按地区,2021 年至 2034 年
- 主要趋势
- 北美洲
- 我们
- 加拿大
- 欧洲
- 德国
- 英国
- 法国
- 西班牙
- 义大利
- 荷兰
- 亚太地区
- 中国
- 日本
- 印度
- 澳洲
- 韩国
- 拉丁美洲
- 巴西
- 墨西哥
- 阿根廷
- 中东和非洲
- 南非
- 沙乌地阿拉伯
- 阿联酋
第八章:公司简介
- Agilent Technologies
- Advanced Chemistry Development
- Bruker Corporation
- Danaher Corporation
- Genedata
- Lablicate
- Microsaic Systems
- OpenMS
- SCIEX
- Shimadzu Corporation
- SpectralWorks
- Spectrum Software Solutions
- StellarNet
- Thermo Fisher Scientific
- Waters Corporation
The Global Spectroscopy Software Market was valued at USD 1.1 billion in 2024 and is projected to grow at an impressive CAGR of 9.1% from 2025 to 2034. Spectroscopy software plays a crucial role in working with spectrometers, facilitating the efficient collection, analysis, and interpretation of spectral data across a wide range of applications. This software is essential for industries that rely on precise and accurate measurements, making it a pivotal tool in various sectors.
The market is divided by deployment type into on-premises and cloud-based solutions. In 2024, the on-premises segment led the market, generating USD 549.5 million in revenue, and is expected to continue experiencing robust growth throughout the forecast period. On-premises solutions are particularly favored by organizations that require enhanced control over sensitive data, which is critical for compliance with industry regulations. Industries such as healthcare and pharmaceuticals, where data security is paramount, strongly prefer on-premises deployment models. These solutions ensure the necessary security and control over information, making them indispensable in meeting stringent regulatory standards.
| Market Scope | |
|---|---|
| Start Year | 2024 |
| Forecast Year | 2025-2034 |
| Start Value | $1.1 Billion |
| Forecast Value | $2.5 Billion |
| CAGR | 9.1% |
In terms of application, the market is segmented into food testing, environmental testing, forensic science, pharmaceuticals, and other sectors. The pharmaceutical industry accounted for 28.9% of the market share in 2024 and is expected to experience substantial growth in the coming years. The increasing demand for precision and high-quality standards in drug development, along with tightening regulatory requirements, is driving the growing adoption of spectroscopy software. Furthermore, the rising need for high-throughput screening in drug discovery is fueling the use of these software solutions. Researchers are increasingly relying on spectroscopy software to manage large datasets, streamline workflows, and accelerate research outcomes in drug development and clinical testing.
In the United States, the spectroscopy software market generated USD 310.2 million in 2024. The U.S. remains a dominant force in the global market, home to leading developers of spectroscopy software and instrument manufacturers. The widespread adoption of advanced analytical technologies in U.S. laboratories, combined with the strict regulatory environment in industries such as pharmaceuticals and food safety, continues to drive the demand for cutting-edge spectroscopy software solutions. These factors, coupled with ongoing technological advancements, are expected to sustain the growth of the U.S. market and contribute to its continued expansion over the next decade.
Table of Contents
Chapter 1 Methodology & Scope
- 1.1 Market scope & definitions
- 1.2 Research design
- 1.2.1 Research approach
- 1.2.2 Data collection methods
- 1.3 Base estimates & calculations
- 1.3.1 Base year calculation
- 1.3.2 Key trends for market estimation
- 1.4 Forecast model
- 1.5 Primary research and validation
- 1.5.1 Primary sources
- 1.5.2 Data mining sources
Chapter 2 Executive Summary
- 2.1 Industry 3600 synopsis
Chapter 3 Industry Insights
- 3.1 Industry ecosystem analysis
- 3.2 Industry impact forces
- 3.2.1 Growth drivers
- 3.2.1.1 Growing demand of spectroscopy software in pharmaceutical industry
- 3.2.1.2 Environmental and food safety regulations
- 3.2.1.3 Technological advancements
- 3.2.1.4 Rise in research and development investments in academic and research institutions
- 3.2.2 Industry pitfalls & challenges
- 3.2.2.1 Data security concerns
- 3.2.1 Growth drivers
- 3.3 Growth potential analysis
- 3.4 Regulatory landscape
- 3.4.1 U.S.
- 3.4.2 Europe
- 3.5 Technology landscape
- 3.6 Future market trends
- 3.7 Key news and initiatives
- 3.8 Gap analysis
- 3.9 Porter’s analysis
- 3.10 PESTEL analysis
Chapter 4 Competitive Landscape, 2024
- 4.1 Introduction
- 4.2 Company market share analysis
- 4.3 Company matrix analysis
- 4.4 Competitive analysis of major market players
- 4.5 Competitive positioning matrix
- 4.6 Strategy dashboard
Chapter 5 Market Estimates and Forecast, By Deployment Type, 2021 – 2034 ($ Mn)
- 5.1 Key trends
- 5.2 On-premises
- 5.3 Cloud
Chapter 6 Market Estimates and Forecast, By Application, 2021 – 2034 ($ Mn)
- 6.1 Key trends
- 6.2 Food testing
- 6.3 Environmental testing
- 6.4 Forensic science
- 6.5 Pharmaceuticals
- 6.6 Other applications
Chapter 7 Market Estimates and Forecast, By Region, 2021 – 2034 ($ Mn)
- 7.1 Key trends
- 7.2 North America
- 7.2.1 U.S.
- 7.2.2 Canada
- 7.3 Europe
- 7.3.1 Germany
- 7.3.2 UK
- 7.3.3 France
- 7.3.4 Spain
- 7.3.5 Italy
- 7.3.6 Netherlands
- 7.4 Asia Pacific
- 7.4.1 China
- 7.4.2 Japan
- 7.4.3 India
- 7.4.4 Australia
- 7.4.5 South Korea
- 7.5 Latin America
- 7.5.1 Brazil
- 7.5.2 Mexico
- 7.5.3 Argentina
- 7.6 Middle East and Africa
- 7.6.1 South Africa
- 7.6.2 Saudi Arabia
- 7.6.3 UAE
Chapter 8 Company Profiles
- 8.1 Agilent Technologies
- 8.2 Advanced Chemistry Development
- 8.3 Bruker Corporation
- 8.4 Danaher Corporation
- 8.5 Genedata
- 8.6 Lablicate
- 8.7 Microsaic Systems
- 8.8 OpenMS
- 8.9 SCIEX
- 8.10 Shimadzu Corporation
- 8.11 SpectralWorks
- 8.12 Spectrum Software Solutions
- 8.13 StellarNet
- 8.14 Thermo Fisher Scientific
- 8.15 Waters Corporation
 2026年全球光谱软体市场报告
 光谱分析市场-全球产业规模、份额、趋势、机会、预测:按类型、产品、应用、地区和竞争格局划分,2021-2031年
 日本光谱学市场报告:按类型、产品类型、应用、最终用户和地区划分(2026-2034年)
 光谱市场规模、份额和成长分析(按类型、产品类型、应用、最终用户和地区划分)-2026-2033年产业预测
 光谱学软体市场按部署模式、公司规模、应用和最终用户划分-2025-2032年全球预测
 光谱市场:依产品类型、最终用户和地区划分
 光谱市场评估:依类型、产品、应用、最终用户、地区、机会和预测,2018年至2032年
 全球光谱市场:市场规模、份额和趋势分析(按应用、类型、产品、最终用途、地区和细分市场,2025-2030 年)
 光谱市场报告:趋势、预测和竞争分析(至 2030 年)
 全球光谱分析市场,2024-2028