


 |
市场调查报告书
商品编码
1665270
同视机市场机会、成长动力、产业趋势分析与 2025 - 2034 年预测Synoptophore Market Opportunity, Growth Drivers, Industry Trend Analysis, and Forecast 2025 - 2034 |
||||||
2024 年全球同视机市场价值为 2.523 亿美元,预计将保持稳定成长率,2025 年至 2034 年的年复合成长率(CAGR) 为 5.5%。随着人们对早期诊断重要性的认识不断提高,以及非侵入性诊断技术的不断进步,对同视机的需求日益增长。这些设备正在成为诊断和治疗各种视力障碍不可或缺的工具,特别是在儿科和眼科护理中。
根据模式,市场主要分为手动和自动同视机,其中手动部分预计仍将是重要的收入来源。到 2034 年,该部分预计将达到 2.148 亿美元,复合年增长率为 5%。手动同视机因其价格便宜、可靠、使用方便而受到青睐。这些设备提供了经济高效的解决方案,特别适合较小的医疗机构或预算有限的地区。其简单而有效的设计使医疗保健专业人员在视力检查期间能够更好地控制,从而使其能够有效地解决复杂的视力障碍。手动同视机持续受到青睐也因为其操作简单,不需要高级的技术专长。
| 市场范围 | |
|---|---|
| 起始年份 | 2024 |
| 预测年份 | 2025-2034 |
| 起始值 | 2.523亿美元 |
| 预测值 | 4.22亿美元 |
| 复合年增长率 | 5.5% |
就最终用途而言,同视机市场分为医院、眼科中心和其他医疗机构。 2024 年,医院以 47% 的主导份额引领市场,预计在整个预测期内都将保持这一领先地位。医院是同视机的主要用户,因为它们有能力投资最先进的诊断设备并处理大量的患者。这些设施配备了精确诊断和全面治疗介入所需的基础设施,在视力復健中发挥关键作用。人们越来越关注提高诊断准确性和患者护理,这推动了医院眼科部门越来越多地采用同视机。
在美国,同视机市场在 2024 年的价值为 9,130 万美元,预计在 2025 年至 2034 年期间的复合年增长率为 5%。此外,包括将数位功能整合到同视机在内的技术进步正在提高诊断的精确度并改善治疗效果。这些设备对于早期发现视力矫正问题至关重要,可以及时介入并取得更好的患者治疗效果。
目录
第 1 章:方法论与范围
第 2 章:执行摘要
第 3 章:产业洞察
- 产业生态系统分析
- 产业衝击力
- 成长动力
- 自动化和数位化同视机的进展
- 增加医疗支出并改善眼科保健基础设施
- 弱视、斜视等双眼视觉障碍的盛行率不断上升
- 产业陷阱与挑战
- 需要熟练的专业人员有效地操作同视机
- 成长动力
- 成长潜力分析
- 监管格局
- 技术格局
- 差距分析
- 波特的分析
- PESTEL 分析
- 未来市场趋势
- 价值链分析
第四章:竞争格局
- 介绍
- 公司矩阵分析
- 公司市占率分析
- 主要市场参与者的竞争分析
- 竞争定位矩阵
- 策略仪表板
第 5 章:市场估计与预测:按模式,2021 – 2034 年
- 主要趋势
- 手动的
- 自动的
第 6 章:市场估计与预测:按应用,2021 年至 2034 年
- 主要趋势
- 诊断
- 疗法
- 杂交种
第 7 章:市场估计与预测:依最终用途,2021 年至 2034 年
- 主要趋势
- 医院
- 眼科中心
- 其他最终用户
第 8 章:市场估计与预测:按地区,2021 年至 2034 年
- 主要趋势
- 北美洲
- 我们
- 加拿大
- 欧洲
- 德国
- 英国
- 法国
- 西班牙
- 义大利
- 荷兰
- 亚太地区
- 中国
- 日本
- 印度
- 澳洲
- 韩国
- 拉丁美洲
- 巴西
- 墨西哥
- 阿根廷
- 中东和非洲
- 南非
- 沙乌地阿拉伯
- 阿联酋
第九章:公司简介
- APPASAMY ASSOCIATES
- DEVINE MEDITECH
- GEM OPTICAL
- HAAG-STREIT
- REDSUN
- NAUGRA
- Roslane Meditech
- Vowish Optical
- 66 Vision-Tech
- YTS Pharmaceuticals
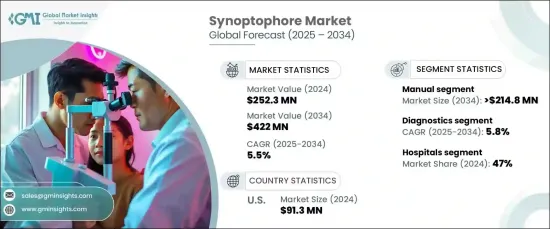
The Global Synoptophore Market was valued at USD 252.3 million in 2024 and is projected to experience a steady growth rate, expanding at a compound annual growth rate (CAGR) of 5.5% from 2025 to 2034. This market growth is largely driven by the increasing prevalence of binocular vision disorders such as amblyopia and strabismus. With rising awareness about the importance of early diagnosis, along with continuous advancements in non-invasive diagnostic technologies, the demand for synoptophores is gaining momentum. These devices are becoming indispensable tools in the diagnosis and treatment of various visual impairments, particularly within pediatric and ophthalmic care.
The market is primarily segmented by mode into manual and automatic synoptophores, with the manual segment expected to remain a significant revenue contributor. By 2034, this segment is projected to reach USD 214.8 million, growing at a CAGR of 5%. Manual synoptophores are favored for their affordability, reliability, and ease of use. These devices offer a cost-effective solution, making them particularly suitable for smaller healthcare facilities or regions with budget constraints. Their simple yet efficient design allows healthcare professionals to have greater control during visual examinations, making them highly effective for addressing complex vision disorders. The continued preference for manual synoptophores is also due to their user-friendly operation, which does not require advanced technical expertise.
| Market Scope | |
|---|---|
| Start Year | 2024 |
| Forecast Year | 2025-2034 |
| Start Value | $252.3 Million |
| Forecast Value | $422 Million |
| CAGR | 5.5% |
In terms of end use, the synoptophore market is divided into hospitals, ophthalmic centers, and other healthcare facilities. In 2024, hospitals led the market with a dominant share of 47% and are expected to maintain this leading position throughout the forecast period. Hospitals are major users of synoptophores due to their ability to invest in state-of-the-art diagnostic equipment and handle large patient volumes. These facilities are equipped with the infrastructure necessary for precise diagnostics and comprehensive therapeutic interventions, playing a critical role in vision rehabilitation. The growing focus on enhancing diagnostic accuracy and patient care is driving the increased adoption of synoptophores within hospital ophthalmology departments.
In the U.S., the synoptophore market was valued at USD 91.3 million in 2024 and is expected to grow at a CAGR of 5% from 2025 to 2034. Increasing awareness about visual health, coupled with the rising rates of amblyopia and strabismus, is fueling the demand for synoptophores in the region. Moreover, technological advancements, including the integration of digital features into synoptophores, are boosting diagnostic precision and improving treatment outcomes. These devices are crucial for the early identification of vision alignment issues, allowing for timely intervention that leads to better patient outcomes.
Table of Contents
Chapter 1 Methodology and Scope
- 1.1 Market scope and definitions
- 1.2 Research design
- 1.2.1 Research approach
- 1.2.2 Data collection methods
- 1.3 Base estimates and calculations
- 1.3.1 Base year calculation
- 1.3.2 Key trends for market estimation
- 1.4 Forecast model
- 1.5 Primary research and validation
- 1.5.1 Primary sources
- 1.5.2 Data mining sources
Chapter 2 Executive Summary
- 2.1 Industry 3600 synopsis
Chapter 3 Industry Insights
- 3.1 Industry ecosystem analysis
- 3.2 Industry impact forces
- 3.2.1 Growth drivers
- 3.2.1.1 Advancements in automated and digital synoptophores
- 3.2.1.2 Increasing healthcare spending and improved eye care infrastructure
- 3.2.1.3 Growing prevalence of binocular vision disorders like amblyopia and strabismus
- 3.2.2 Industry pitfalls and challenges
- 3.2.2.1 Need for skilled professionals to operate synoptophores effectively
- 3.2.1 Growth drivers
- 3.3 Growth potential analysis
- 3.4 Regulatory landscape
- 3.5 Technology landscape
- 3.6 Gap analysis
- 3.7 Porter's analysis
- 3.8 PESTEL analysis
- 3.9 Future market trends
- 3.10 Value chain analysis
Chapter 4 Competitive Landscape, 2024
- 4.1 Introduction
- 4.2 Company matrix analysis
- 4.3 Company market share analysis
- 4.4 Competitive analysis of major market players
- 4.5 Competitive positioning matrix
- 4.6 Strategy dashboard
Chapter 5 Market Estimates and Forecast, By Mode, 2021 – 2034 ($ Mn)
- 5.1 Key trends
- 5.2 Manual
- 5.3 Automatic
Chapter 6 Market Estimates and Forecast, By Application, 2021 – 2034 ($ Mn)
- 6.1 Key trends
- 6.2 Diagnostics
- 6.3 Therapeutics
- 6.4 Hybrid
Chapter 7 Market Estimates and Forecast, By End Use, 2021 – 2034 ($ Mn)
- 7.1 Key trends
- 7.2 Hospitals
- 7.3 Ophthalmic centers
- 7.4 Other end users
Chapter 8 Market Estimates and Forecast, By Region, 2021 – 2034 ($ Mn)
- 8.1 Key trends
- 8.2 North America
- 8.2.1 U.S.
- 8.2.2 Canada
- 8.3 Europe
- 8.3.1 Germany
- 8.3.2 UK
- 8.3.3 France
- 8.3.4 Spain
- 8.3.5 Italy
- 8.3.6 Netherlands
- 8.4 Asia Pacific
- 8.4.1 China
- 8.4.2 Japan
- 8.4.3 India
- 8.4.4 Australia
- 8.4.5 South Korea
- 8.5 Latin America
- 8.5.1 Brazil
- 8.5.2 Mexico
- 8.5.3 Argentina
- 8.6 Middle East and Africa
- 8.6.1 South Africa
- 8.6.2 Saudi Arabia
- 8.6.3 UAE
Chapter 9 Company Profiles
- 9.1 APPASAMY ASSOCIATES
- 9.2 DEVINE MEDITECH
- 9.3 GEM OPTICAL
- 9.4 HAAG-STREIT
- 9.5 REDSUN
- 9.6 NAUGRA
- 9.7 Roslane Meditech
- 9.8 Vowish Optical
- 9.9 66 Vision-Tech
- 9.10 YTS Pharmaceuticals


