


 |
市场调查报告书
商品编码
1665275
硬接线商用电涌保护装置市场机会、成长动力、产业趋势分析与 2025 - 2034 年预测Hard-Wired Commercial Surge Protection Devices Market Opportunity, Growth Drivers, Industry Trend Analysis, and Forecast 2025 - 2034 |
||||||
2024资料全球硬接线商用电涌保护装置市场价值为 4.925 亿美元,预计 2025 年至 2034 年期间将以 6.1% 的强劲复合年增长率增长。这些设备在资料中心、IT基础设施和智慧建筑技术中的应用日益广泛,进一步推动了市场的扩张。
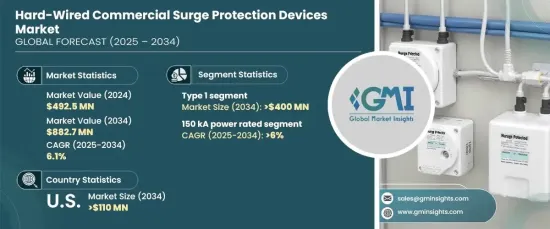
预计到 2034 年,1 型硬体连线商用电涌保护装置市场规模将达到 4 亿美元,这主要得益于对具有卓越电压箝位能力和快速响应时间的设备的需求。人们对智慧建筑、物联网自动化和严格安全标准遵守的关注度不断上升,这正在增强市场渗透率。此外,对尖端电气系统的持续投资以及监控和诊断技术的整合正在加速各行业的应用。
| 市场范围 | |
|---|---|
| 起始年份 | 2024 |
| 预测年份 | 2025-2034 |
| 起始值 | 4.925亿美元 |
| 预测值 | 8.827 亿美元 |
| 复合年增长率 | 6.1% |
预计到 2034 年,额定功率超过 150 kA 的突波保护装置的成长率将达到 6%。资料中心和医疗保健等领域的应用不断扩大,加上雷击等极端天气事件发生的频率不断增加,大大增强了市场机会。
预计到 2034 年,美国硬连线商用电涌保护装置产业将创收 1.1 亿美元,这得益于人们越来越依赖保护关键基础设施和敏感电子设备免受电涌影响。电网的现代化以及包括伺服器、医疗设备和自动化技术在内的精密电子系统的广泛部署正在加强市场的成长轨迹。
目录
第 1 章:方法论与范围
- 市场范围和定义
- 市场估计和预测参数
- 预测计算
- 资料来源
- 基本的
- 次要
- 有薪资的
- 民众
第 2 章:执行摘要
第 3 章:产业洞察
- 产业生态系统分析
- 监管格局
- 产业衝击力
- 成长动力
- 产业陷阱与挑战
- 成长潜力分析
- 波特的分析
- 供应商的议价能力
- 买家的议价能力
- 新进入者的威胁
- 替代品的威胁
- PESTEL 分析
第四章:竞争格局
- 介绍
- 战略展望
- 创新与永续发展格局
第 5 章:市场规模及预测:依技术分类,2021 – 2034 年
- 主要趋势
- 类型 1
- 类型 2
- 类型 3
第六章:市场规模及预测:依功率等级,2021 – 2034 年
- 主要趋势
- ≤ 50kA
- > 50 kA 至 100 kA
- > 100 kA 至 150 kA
- >150千安
第 7 章:市场规模及预测:按地区,2021 – 2034 年
- 主要趋势
- 北美洲
- 我们
- 加拿大
- 墨西哥
- 欧洲
- 德国
- 法国
- 俄罗斯
- 英国
- 义大利
- 西班牙
- 荷兰
- 奥地利
- 亚太地区
- 中国
- 日本
- 韩国
- 印度
- 澳洲
- 纽西兰
- 马来西亚
- 印尼
- 中东和非洲
- 沙乌地阿拉伯
- 阿联酋
- 卡达
- 埃及
- 南非
- 奈及利亚
- 科威特
- 阿曼
- 拉丁美洲
- 巴西
- 秘鲁
- 阿根廷
第八章:公司简介
- ABB
- Belkin
- Eaton
- Emerson Electric
- Hubbell
- Infineon Technologies
- Intermatic
- JMV
- Legrand
- Littelfuse
- Philips
- Phoenix Contact
- Schneider Electric
- Siemens
- Socomec
The Global Hard-Wired Commercial Surge Protection Devices Market was valued at USD 492.5 million in 2024 and is anticipated to grow at a robust CAGR of 6.1% from 2025 to 2034. The rising need to protect sensitive electrical systems from power surges-responsible for equipment damage, data loss, and financial disruptions-is a key driver of market growth. The increasing adoption of these devices in data centers, IT infrastructures, and smart building technologies further propels the market's expansion.
The Type 1 hard-wired commercial surge protection devices segment is forecasted to reach USD 400 million by 2034, fueled by demand for devices offering superior voltage clamping capabilities and rapid response times. The surging focus on smart buildings, IoT-enabled automation, and compliance with stringent safety standards is bolstering market penetration. Additionally, ongoing investments in cutting-edge electrical systems and the integration of monitoring and diagnostic technologies are accelerating adoption across industries.
| Market Scope | |
|---|---|
| Start Year | 2024 |
| Forecast Year | 2025-2034 |
| Start Value | $492.5 Million |
| Forecast Value | $882.7 Million |
| CAGR | 6.1% |
Surge protection devices with power ratings exceeding 150 kA are projected to experience a growth rate of 6% through 2034. The heightened use of systems with higher surge current ratings to safeguard crucial assets from electrical disturbances is driving this demand. Expanding applications in sectors such as data centers and healthcare, coupled with the increasing frequency of extreme weather events like lightning strikes, are significantly enhancing market opportunities.
The U.S. hard-wired commercial surge protection devices industry is expected to generate USD 110 million by 2034, underpinned by a growing reliance on safeguarding critical infrastructure and sensitive electronics from power surges. The modernization of grid networks and the extensive deployment of delicate electronic systems, including servers, medical equipment, and automated technologies, are strengthening the market's growth trajectory.
Table of Contents
Chapter 1 Methodology & Scope
- 1.1 Market scope & definitions
- 1.2 Market estimates & forecast parameters
- 1.3 Forecast calculation
- 1.4 Data sources
- 1.4.1 Primary
- 1.4.2 Secondary
- 1.4.2.1 Paid
- 1.4.2.2 Public
Chapter 2 Executive Summary
- 2.1 Industry synopsis, 2021 - 2034
Chapter 3 Industry Insights
- 3.1 Industry ecosystem analysis
- 3.2 Regulatory landscape
- 3.3 Industry impact forces
- 3.3.1 Growth drivers
- 3.3.2 Industry pitfalls & challenges
- 3.4 Growth potential analysis
- 3.5 Porter's analysis
- 3.5.1 Bargaining power of suppliers
- 3.5.2 Bargaining power of buyers
- 3.5.3 Threat of new entrants
- 3.5.4 Threat of substitutes
- 3.6 PESTEL analysis
Chapter 4 Competitive Landscape, 2024
- 4.1 Introduction
- 4.2 Strategic outlook
- 4.3 Innovation & sustainability landscape
Chapter 5 Market Size and Forecast, By Technology, 2021 – 2034 ('000 Units & USD Million)
- 5.1 Key trends
- 5.2 Type 1
- 5.3 Type 2
- 5.4 Type 3
Chapter 6 Market Size and Forecast, By Power Rating, 2021 – 2034 ('000 Units & USD Million)
- 6.1 Key trends
- 6.2 ≤ 50 kA
- 6.3 > 50 kA to 100 kA
- 6.4 > 100 kA to 150 kA
- 6.5 > 150 kA
Chapter 7 Market Size and Forecast, By Region, 2021 – 2034 ('000 Units & USD Million)
- 7.1 Key trends
- 7.2 North America
- 7.2.1 U.S.
- 7.2.2 Canada
- 7.2.3 Mexico
- 7.3 Europe
- 7.3.1 Germany
- 7.3.2 France
- 7.3.3 Russia
- 7.3.4 UK
- 7.3.5 Italy
- 7.3.6 Spain
- 7.3.7 Netherlands
- 7.3.8 Austria
- 7.4 Asia Pacific
- 7.4.1 China
- 7.4.2 Japan
- 7.4.3 South Korea
- 7.4.4 India
- 7.4.5 Australia
- 7.4.6 New Zealand
- 7.4.7 Malaysia
- 7.4.8 Indonesia
- 7.5 Middle East & Africa
- 7.5.1 Saudi Arabia
- 7.5.2 UAE
- 7.5.3 Qatar
- 7.5.4 Egypt
- 7.5.5 South Africa
- 7.5.6 Nigeria
- 7.5.7 Kuwait
- 7.5.8 Oman
- 7.6 Latin America
- 7.6.1 Brazil
- 7.6.2 Peru
- 7.6.3 Argentina
Chapter 8 Company Profiles
- 8.1 ABB
- 8.2 Belkin
- 8.3 Eaton
- 8.4 Emerson Electric
- 8.5 Hubbell
- 8.6 Infineon Technologies
- 8.7 Intermatic
- 8.8 JMV
- 8.9 Legrand
- 8.10 Littelfuse
- 8.11 Philips
- 8.12 Phoenix Contact
- 8.13 Schneider Electric
- 8.14 Siemens
- 8.15 Socomec
 全球突波保护装置(SPD)市场、性能与预测(2020-2031)
 突波保护设备的全球市场(2025年):终端用户,用途,竞争企业:分析与预测
 突波保护零组件的全球市场(2025年)- 终端用户,用途,竞争企业
 2032 年突波保护装置市场预测:按产品类型、类型、标称放电电流、电压等级、安装位置、最终用户和地区进行的全球分析
 突波保护装置市场:按产品类型、安装类型、相类型、技术类型、销售管道和应用 - 2025-2030 年全球预测
 全球瞬态保护装置市场全球工业突波保护装置市场全球闸流体突波保护装置(TSPD)市场全球闸流体突波抑制器市场
 突波保护装置市场:全球按产品、技术、标称放电电流、最终用户和地区划分 - 预测至 2030 年