


 |
市场调查报告书
商品编码
1665317
虚拟发电厂市场机会、成长动力、产业趋势分析与 2025 - 2034 年预测Virtual Power Plant Market Opportunity, Growth Drivers, Industry Trend Analysis, and Forecast 2025 - 2034 |
||||||
预计全球虚拟发电厂市场规模将在 2024 年达到 46 亿美元,预计在 2025 年至 2034 年期间将实现 21.6% 的显着复合年增长率。透过聚合分散式资源的能源,这些先进的系统优化了生产、消费和分配,作为单一实体无缝运作。这种创新方法提高了电网稳定性、提高了能源效率、简化了资源管理,有助于建立更可靠和永续的能源生态系统。
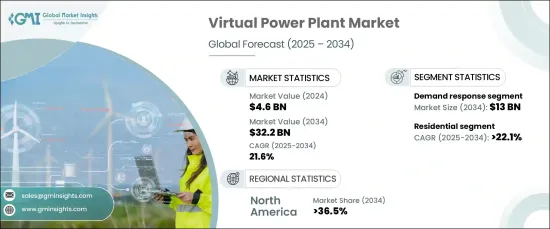
VPP 市场分为几个关键技术部分,包括分散式能源资源、需求响应和混合资产系统。其中,需求响应部门预计到 2034 年将创造 130 亿美元的收入。需求响应系统有助于减轻现有基础设施的压力,最大限度地减少对额外发电能力的需求并提高能源效率。随着对经济高效的能源解决方案的需求不断增长,需求响应系统已成为 VPP 的重要组成部分,从而实现了更动态和可持续的能源电网。
| 市场范围 | |
|---|---|
| 起始年份 | 2024 |
| 预测年份 | 2025-2034 |
| 起始值 | 46亿美元 |
| 预测值 | 322亿美元 |
| 复合年增长率 | 21.6% |
对于最终用户而言,VPP 市场分为住宅、工业和商业应用。预计到 2034 年,工业领域的复合年增长率将达到惊人的 20.5%。此外,对永续发展目标和碳减排的日益关注也加速了虚拟工厂模式在工业领域的应用。随着工业部门越来越重视可靠、节能的系统来支援持续运营,虚拟电厂 (VPP) 已成为其能源策略的重要组成部分。
在美国,虚拟发电厂市场预计到 2034 年将创收 92 亿美元。联邦政策,例如针对再生能源和储存技术的税收抵免和补助,正在为 VPP 部署创造有利的环境。这些政策不仅增强了能源安全,也促进了住宅和工业领域广泛采用先进的电力管理系统。
目录
第 1 章:方法论与范围
- 市场定义
- 基础估算与计算
- 预测计算
- 初步研究与验证
- 主要来源
- 资料探勘来源
- 市场定义
第 2 章:执行摘要
第 3 章:产业洞察
- 产业生态系统
- 监管格局
- 产业衝击力
- 成长动力
- 产业陷阱与挑战
- 成长潜力分析
- 波特的分析
- 供应商的议价能力
- 买家的议价能力
- 新进入者的威胁
- 替代品的威胁
- PESTEL 分析
第四章:竞争格局
- 介绍
- 战略仪表板
- 创新与永续发展格局
第 5 章:市场规模与预测:依技术,2021 – 2034 年
- 主要趋势
- 分散式能源
- 需求回应
- 混合资产
第 6 章:市场规模与预测:依最终用途,2021 – 2034 年
- 主要趋势
- 住宅
- 工业的
- 商业的
第 7 章:市场规模及预测:按地区,2021 – 2034 年
- 主要趋势
- 北美洲
- 我们
- 加拿大
- 欧洲
- 德国
- 法国
- 英国
- 义大利
- 亚太地区
- 中国
- 日本
- 韩国
- 印度
- 世界其他地区
第八章:公司简介
- AGL Energy
- Bosch Global
- Enel X
- Enbala Power Networks
- Hitachi
- Tesla
- Statkraft
- Shell
- Siemens
- Schneider Electric
The Global Virtual Power Plant Market is anticipated to reach USD 4.6 billion in 2024 and is projected to experience a remarkable growth rate of 21.6% CAGR from 2025 to 2034. VPPs are revolutionizing the energy sector by integrating decentralized, small-scale power generation units into a cohesive network managed by a central system. By aggregating energy from distributed resources, these advanced systems optimize production, consumption, and distribution, operating seamlessly as a single entity. This innovative approach boosts grid stability, enhances energy efficiency, and simplifies resource management, contributing to a more reliable and sustainable energy ecosystem.
The VPP market is divided into key technological segments, including distributed energy resources, demand response, and mixed asset systems. Among these, the demand response segment is poised to generate USD 13 billion by 2034. This growth is driven by its capability to enhance grid reliability, prevent outages, and enable more cost-effective energy management. Demand response systems help reduce strain on existing infrastructure, minimizing the need for additional power generation capacity and promoting energy efficiency. As the demand for affordable and efficient energy solutions rises, demand response systems have become a vital component of VPPs, enabling a more dynamic and sustainable energy grid.
| Market Scope | |
|---|---|
| Start Year | 2024 |
| Forecast Year | 2025-2034 |
| Start Value | $4.6 Billion |
| Forecast Value | $32.2 Billion |
| CAGR | 21.6% |
When it comes to end users, the VPP market is categorized into residential, industrial, and commercial applications. The industrial segment is projected to grow at an impressive CAGR of 20.5% through 2034. Rising energy demands within industrial operations are driving the need for solutions that can lower costs by shifting energy loads, reducing peak demand, and providing real-time energy management. Additionally, the growing focus on sustainability goals and carbon emission reductions is accelerating the adoption of VPPs in industries. As industrial sectors increasingly prioritize reliable and energy-efficient systems to support continuous operations, VPPs have become an essential part of their energy strategies.
In the U.S., the virtual power plant market is forecast to generate USD 9.2 billion by 2034. The challenges of maintaining grid stability due to aging infrastructure, extreme weather events, and increasing energy demand are spurring the adoption of VPPs to ensure resilience. Federal policies, such as tax credits and grants for renewable energy and storage technologies, are creating a favorable environment for VPP deployment. These policies not only enhance energy security but also promote the widespread adoption of advanced power management systems in both residential and industrial sectors.
Table of Contents
Chapter 1 Methodology & Scope
- 1.1 Market definitions
- 1.2 Base estimates & calculations
- 1.3 Forecast calculation
- 1.4 Primary research & validation
- 1.4.1 Primary sources
- 1.4.2 Data mining sources
- 1.5 Market definitions
Chapter 2 Executive Summary
- 2.1 Industry synopsis, 2021 – 2034
Chapter 3 Industry Insights
- 3.1 Industry ecosystem
- 3.2 Regulatory landscape
- 3.3 Industry impact forces
- 3.3.1 Growth drivers
- 3.3.2 Industry pitfalls & challenges
- 3.4 Growth potential analysis
- 3.5 Porter's analysis
- 3.5.1 Bargaining power of suppliers
- 3.5.2 Bargaining power of buyers
- 3.5.3 Threat of new entrants
- 3.5.4 Threat of substitutes
- 3.6 PESTEL analysis
Chapter 4 Competitive landscape, 2024
- 4.1 Introduction
- 4.2 Strategic dashboard
- 4.3 Innovation & sustainability landscape
Chapter 5 Market Size and Forecast, By Technology, 2021 – 2034 (USD Billion)
- 5.1 Key trends
- 5.2 Distributed energy resource
- 5.3 Demand response
- 5.4 Mixed asset
Chapter 6 Market Size and Forecast, By End Use, 2021 – 2034 (USD Billion)
- 6.1 Key trends
- 6.2 Residential
- 6.3 Industrial
- 6.4 Commercial
Chapter 7 Market Size and Forecast, By Region, 2021 – 2034 (USD Billion)
- 7.1 Key trends
- 7.2 North America
- 7.2.1 U.S.
- 7.2.2 Canada
- 7.3 Europe
- 7.3.1 Germany
- 7.3.2 France
- 7.3.3 UK
- 7.3.4 Italy
- 7.4 Asia Pacific
- 7.4.1 China
- 7.4.2 Japan
- 7.4.3 South Korea
- 7.4.4 India
- 7.5 Rest of World
Chapter 8 Company Profiles
- 8.1 AGL Energy
- 8.2 Bosch Global
- 8.3 Enel X
- 8.4 Enbala Power Networks
- 8.5 Hitachi
- 8.6 Tesla
- 8.7 Statkraft
- 8.8 Shell
- 8.9 Siemens
- 8.10 Schneider Electric
 欧洲虚拟电厂市场按最终用户、技术、能源来源和国家划分-分析与预测(2025-2035 年)
 日本虚拟电厂市场报告(按技术(分散式发电、需求响应、混合资产)、最终用户(工业、商业、住宅)和地区划分,2026-2034 年)
 虚拟电厂市场规模、份额和成长分析(按技术、产品、能源、产业和地区划分):产业预测(2026-2033 年)
 全球虚拟电厂(VPP)市场:按应用、产品和地区分類的分析和预测(2025-2035 年)
 2025年全球虚拟电厂市场报告
 北美虚拟电厂 (VPP) 报告:2025
 虚拟发电厂市场按组件、技术、能源来源、部署模式、类别和最终用户划分-2025-2030 年全球预测虚拟发电厂市场报告,按技术(配电发电、需求响应、混合资产)、来源(再生能源、热电联产、储能)、最终用户(工业、商业、住宅)和地区划分,2025 年至 2033 年
 全球虚拟发电厂市场规模、份额、趋势分析报告 - 按技术、最终用途和地区分類的展望和预测,2024 年至 2031 年
 虚拟发电厂市场规模、份额、趋势分析报告:按技术、最终用途、地区、细分预测,2025-2030 年