


 |
市场调查报告书
商品编码
1665323
製造规模静电除尘器市场机会、成长动力、产业趋势分析与预测 2025 - 2034Manufacturing Scale Electrostatic Precipitator Market Opportunity, Growth Drivers, Industry Trend Analysis, and Forecast 2025 - 2034 |
||||||
2024 年全球製造规模静电除尘器市场规模达到 8.652 亿美元,预计 2025 年至 2034 年期间将以 6.8% 的强劲复合年增长率增长。它们的工作原理是利用高压电场使气流中的粒子带电,使粒子聚集在带相反电荷的薄片或探针上。透过振动或敲击定期清除积聚的颗粒,确保持续的效率和高性能。
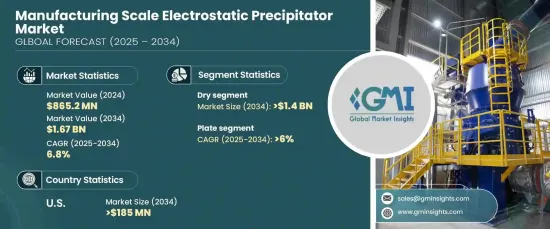
干式静电集尘器市场将经历显着成长,预计到 2034 年将达到 14 亿美元。由于干式静电集尘器具有稳定的性能和最短的停机时间,越来越多的製造商选择干式静电集尘器。这些系统支援生产力目标和遵守环境法规,同时其耐用性和低维护要求可转化为大量长期成本节约,使其成为注重经济和环境永续性的设施的理想选择。
| 市场范围 | |
|---|---|
| 起始年份 | 2024 |
| 预测年份 | 2025-2034 |
| 起始值 | 8.652 亿美元 |
| 预测值 | 16.7 亿美元 |
| 复合年增长率 | 6.8% |
在设计方面,预计到 2034 年,板式静电除尘器领域的复合年增长率将达到 6%。它能够在不影响性能的情况下处理波动的粉尘负荷,这增加了它的吸引力,特别是当行业越来越要求耐腐蚀、耐高温和耐磨损的设计时。这些因素使得板式静电除尘器在最具挑战性的操作环境中能够提供长期可靠性。
预计到 2034 年,美国製造规模静电除尘器市场将创收 1.85 亿美元。各机构执行的严格空气品质法规(包括《清洁空气法》)要求大幅减少颗粒物排放,为市场扩张创造了有利可图的机会。此外,旨在降低维护成本和提高长期投资回报的创新正在进一步推动市场采用并确保整个地区的稳定成长。
目录
第 1 章:方法论与范围
- 研究设计
- 基础估算与计算
- 预测模型
- 初步研究与验证
- 主要来源
- 资料探勘来源
- 市场定义
第 2 章:执行摘要
第 3 章:产业洞察
- 产业生态系统
- 监管格局
- 产业衝击力
- 成长动力
- 产业陷阱与挑战
- 成长潜力分析
- 波特的分析
- 供应商的议价能力
- 买家的议价能力
- 新进入者的威胁
- 替代品的威胁
- PESTEL 分析
第四章:竞争格局
- 介绍
- 战略仪表板
- 创新与技术格局
第 5 章:市场规模及预测:依设计,2021 – 2034 年
- 主要趋势
- 盘子
- 管状
第 6 章:市场规模与预测:按系统,2021 – 2034 年
- 主要趋势
- 干燥
- 湿的
第 7 章:市场规模及预测:按地区,2021 – 2034 年
- 主要趋势
- 北美洲
- 我们
- 加拿大
- 墨西哥
- 欧洲
- 德国
- 英国
- 法国
- 西班牙
- 义大利
- 荷兰
- 亚太地区
- 中国
- 印度
- 日本
- 韩国
- 印尼
- 澳洲
- 中东和非洲
- 沙乌地阿拉伯
- 阿联酋
- 南非
- 奈及利亚
- 安哥拉
- 拉丁美洲
- 巴西
- 阿根廷
- 智利
- 秘鲁
第八章:公司简介
- ANDRITZ GROUP
- Babcock & Wilcox
- Beltran Technologies
- Elex
- Environ Engineers
- GEA Group
- Kraft Powercon
- Thermax
- VT Corp
- Valmet
The Global Manufacturing Scale Electrostatic Precipitator Market reached USD 865.2 million in 2024 and is projected to grow at a robust CAGR of 6.8% from 2025 to 2034. These advanced devices play a crucial role in air pollution control by effectively removing fine particulate matter from industrial flue gases. They operate by charging particles in the gas stream with high-voltage electrical fields, causing the particles to collect on oppositely charged sheets or probes. The accumulated particles are periodically dislodged using vibration or rapping, ensuring continuous efficiency and high performance.
The dry electrostatic precipitator segment is set to experience significant growth, expected to reach USD 1.4 billion by 2034. This system type is highly valued for its ability to provide high-efficiency particle collection, meeting stringent environmental standards and driving widespread adoption across various industries. Manufacturers are increasingly opting for dry electrostatic precipitators due to their consistent performance and minimal operational downtime. These systems support productivity goals and compliance with environmental regulations, while their durability and low maintenance requirements translate into substantial long-term cost savings, making them an ideal choice for facilities focused on both economic and environmental sustainability.
| Market Scope | |
|---|---|
| Start Year | 2024 |
| Forecast Year | 2025-2034 |
| Start Value | $865.2 Million |
| Forecast Value | $1.67 Billion |
| CAGR | 6.8% |
In terms of design, the plate electrostatic precipitator segment is anticipated to grow at a CAGR of 6% through 2034. Renowned for its superior particulate collection efficiency, the plate design excels at capturing fine and ultrafine particles, making it perfect for industries dealing with varying emission profiles. Its ability to handle fluctuating dust loads without compromising performance boosts its appeal, especially as industries increasingly demand designs resistant to corrosion, high temperatures, and wear. These factors contribute to the plate electrostatic precipitator's reputation for providing long-lasting reliability in the most challenging operating environments.
The U.S. manufacturing scale electrostatic precipitator market is forecasted to generate USD 185 million by 2034. As environmental sustainability becomes a top priority, industries across the U.S. are under growing pressure to adopt cleaner technologies, driving up the demand for electrostatic precipitators. The enforcement of strict air quality regulations by agencies, including the Clean Air Act, mandates significant reductions in particulate emissions, creating lucrative opportunities for market expansion. Additionally, innovations aimed at reducing maintenance costs and enhancing long-term returns on investment are further propelling market adoption and ensuring steady growth across the region.
Table of Contents
Chapter 1 Methodology & Scope
- 1.1 Research design
- 1.2 Base estimates & calculations
- 1.3 Forecast model
- 1.4 Primary research & validation
- 1.4.1 Primary sources
- 1.4.2 Data mining sources
- 1.5 Market definitions
Chapter 2 Executive Summary
- 2.1 Industry synopsis, 2021 – 2034
Chapter 3 Industry Insights
- 3.1 Industry ecosystem
- 3.2 Regulatory landscape
- 3.3 Industry impact forces
- 3.3.1 Growth drivers
- 3.3.2 Industry pitfalls & challenges
- 3.4 Growth potential analysis
- 3.5 Porter's analysis
- 3.5.1 Bargaining power of suppliers
- 3.5.2 Bargaining power of buyers
- 3.5.3 Threat of new entrants
- 3.5.4 Threat of substitutes
- 3.6 PESTEL analysis
Chapter 4 Competitive landscape, 2024
- 4.1 Introduction
- 4.2 Strategic dashboard
- 4.3 Innovation & technology landscape
Chapter 5 Market Size and Forecast, By Design, 2021 – 2034 (USD Million)
- 5.1 Key trends
- 5.2 Plate
- 5.3 Tubular
Chapter 6 Market Size and Forecast, By System, 2021 – 2034 (USD Million)
- 6.1 Key trends
- 6.2 Dry
- 6.3 Wet
Chapter 7 Market Size and Forecast, By Region, 2021 – 2034 (USD Million)
- 7.1 Key trends
- 7.2 North America
- 7.2.1 U.S.
- 7.2.2 Canada
- 7.2.3 Mexico
- 7.3 Europe
- 7.3.1 Germany
- 7.3.2 UK
- 7.3.3 France
- 7.3.4 Spain
- 7.3.5 Italy
- 7.3.6 Netherlands
- 7.4 Asia Pacific
- 7.4.1 China
- 7.4.2 India
- 7.4.3 Japan
- 7.4.4 South Korea
- 7.4.5 Indonesia
- 7.4.6 Australia
- 7.5 Middle East & Africa
- 7.5.1 Saudi Arabia
- 7.5.2 UAE
- 7.5.3 South Africa
- 7.5.4 Nigeria
- 7.5.5 Angola
- 7.6 Latin America
- 7.6.1 Brazil
- 7.6.2 Argentina
- 7.6.3 Chile
- 7.6.4 Peru
Chapter 8 Company Profiles
- 8.1 ANDRITZ GROUP
- 8.2 Babcock & Wilcox
- 8.3 Beltran Technologies
- 8.4 Elex
- 8.5 Environ Engineers
- 8.6 GEA Group
- 8.7 Kraft Powercon
- 8.8 Thermax
- 8.9 VT Corp
- 8.10 Valmet
 全球环境颗粒物空气监测器市场(按技术、产品、颗粒尺寸、应用和最终用户划分)预测(2026-2032)
 2026年全球燃烧排放分析仪市场报告2026年全球二氧化碳(CO2)通风控制器市场报告全球空气排放管理软体市场(依最终用户产业、部署模式、组件、公司规模和定价模式划分)预测(2026-2032年)
 室内空气品质监测系统市场规模、占有率、成长及全球产业分析:依类型、应用和地区划分的洞察与预测(2024-2032 年)空气品管系统市场(按产品类型、技术、应用、最终用户和分销管道)—2025-2032 年全球预测空气品管系统市场 - 2025-2030 年预测
 船用静电集尘器市场机会、成长动力、产业趋势分析及 2025 - 2034 年预测
 2032 年空气品管系统市场预测:按产品类型、污染物类型、过滤和净化技术、应用、最终用户和地区进行的全球分析
 空气品管系统市场规模、份额及成长分析(按污染物类型、产品类型、技术、最终用户及地区)-2025-2032 年产业预测