


 |
市场调查报告书
商品编码
1665355
工业无线感测器市场机会、成长动力、产业趋势分析与 2025 - 2034 年预测Industrial Wireless Sensor Market Opportunity, Growth Drivers, Industry Trend Analysis, and Forecast 2025 - 2034 |
||||||
2024 年全球工业无线感测器市场价值为 59 亿美元,预计 2025 年至 2034 年期间复合年增长率将达到惊人的 12.9%。无线感测器在实现无缝机器对机器通讯、促进即时资料收集和控制方面发挥关键作用。这些功能支援流程最佳化、品质保证和预测性维护等关键应用,使无线感测器对于现代工业运作不可或缺。
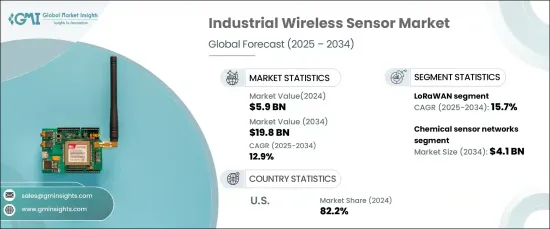
市场涵盖的产品类型多种多样,包括流量感测器、光感测器网路、温度感测器、气体感测器、湿度感测器、压力感测器、液位感测器网路、运动和位置感测器网路、化学感测器网路等。其中,化学感测器网路预计将显着成长,到 2034 年预计将达到 41 亿美元。它们的无线连接允许部署在偏远或危险的地方,而小型化和遵守严格的安全法规的进步进一步加速了市场扩张。
| 市场范围 | |
|---|---|
| 起始年份 | 2024 |
| 预测年份 | 2025-2034 |
| 起始值 | 59亿美元 |
| 预测值 | 198亿美元 |
| 复合年增长率 | 12.9% |
工业无线感测器市场中的连接选项包括 Wi-Fi、LoRaWAN、蓝牙、Zigbee、近场通讯 (NFC)、WirelessHART、蜂巢式网路和 ISA 100.11a。 LoRaWAN 是成长最快的领域,预计在预测期内的复合年增长率为 15.7%。它的受欢迎程度源于其适合长距离、低功耗应用,例如石油、天然气和农业等行业的远端监控。 LoRaWAN 能够在消耗最少能量的情况下远距离传输资料,这使其成为大规模物联网实施的理想选择,特别是在需要广泛感测器网路的行业。
美国引领工业无线感测器市场,到 2024 年将占据 82.2% 的主导份额。旨在促进工业现代化的政府激励措施进一步促进了市场的成长。美国也受益于领先的市场参与者和强大的技术基础设施,这促进了创新并推动了对节能解决方案的需求。无线感测器正成为各行各业不可或缺的一部分,巩固了其在塑造未来工业运作中的作用。
目录
第 1 章:方法论与范围
- 市场范围和定义
- 基础估算与计算
- 预测计算
- 资料来源
- 基本的
- 次要
- 付费来源
- 公共资源
第 2 章:执行摘要
第 3 章:产业洞察
- 产业生态系统分析
- 影响价值链的因素
- 利润率分析
- 中断
- 未来展望
- 製造商
- 经销商
- 供应商概况
- 利润率分析
- 重要新闻及倡议
- 监管格局
- 衝击力
- 成长动力
- 工业自动化的普及
- 工业物联网(IIoT)的扩展
- 无线通讯技术的进步
- 日益关注能源效率和永续性
- 远端监控和预测性维护的需求不断增加
- 产业陷阱与挑战
- 对资料安全和隐私的担忧
- 初始部署成本高且复杂
- 成长动力
- 成长潜力分析
- 波特的分析
- PESTEL 分析
第四章:竞争格局
- 介绍
- 公司市占率分析
- 竞争定位矩阵
- 战略展望矩阵
第 5 章:市场估计与预测:按产品类型,2021-2034 年
- 主要趋势
- 温度感测器
- 气体感测器
- 压力感测器
- 湿度感测器
- 流量感测器
- 液位感测器网络
- 运动和位置感测器网络
- 光感测器网路
- 化学感测器网络
- 其他
第六章:市场估计与预测:依连结性,2021-2034 年
- 主要趋势
- 无线上网
- 蓝牙
- LoRaWAN
- Zigbee
- 近场通讯 (NFC)
- 蜂窝网路
- 无线HART
- ISA 100.11a
第 7 章:市场估计与预测:按应用,2021 年至 2034 年
- 主要趋势
- 机器监控
- 资产追踪
- 过程控制
- 安全管理
- 预测性维护
- 环境监测
- 其他的
第 8 章:市场估计与预测:依最终用途,2021 年至 2034 年
- 主要趋势
- 汽车
- 製造业
- 石油和天然气
- 实用工具
- 矿业
- 其他的
第 9 章:市场估计与预测:按地区,2021 年至 2034 年
- 主要趋势
- 北美洲
- 我们
- 加拿大
- 欧洲
- 英国
- 德国
- 法国
- 义大利
- 西班牙
- 俄罗斯
- 亚太地区
- 中国
- 印度
- 日本
- 韩国
- 澳洲
- 拉丁美洲
- 巴西
- 墨西哥
- 中东及非洲
- 南非
- 沙乌地阿拉伯
- 阿联酋
第十章:公司简介
- ABB Ltd.
- Advantech Co., Ltd.
- Analog Devices, Inc.
- Banner Engineering Corp.
- Beanair SAS
- Bosch Sensortec GmbH
- Digi International Inc.
- Emerson Electric Co.
- Endress+Hauser Group
- General Electric Company
- Honeywell International Inc.
- Microchip Technology Inc.
- Mitsubishi Electric Corporation
- NXP Semiconductors NV
- Omron Corporation
- Pepperl+Fuchs SE
- Rockwell Automation, Inc.
- Schneider Electric SE
- Sensata Technologies Holding PLC
- Siemens AG
- STMicroelectronics NV
- TE Connectivity Ltd.
- Texas Instruments Incorporated
- Yokogawa Electric Corporation
The Global Industrial Wireless Sensor Market was valued at USD 5.9 billion in 2024 and is projected to grow at an impressive CAGR of 12.9% between 2025 and 2034. This remarkable growth is fueled by the rapid adoption of industrial automation, as businesses increasingly embrace advanced technologies to reduce human intervention, enhance operational efficiency, and ensure safety in high-risk environments. Wireless sensors play a pivotal role in enabling seamless machine-to-machine communication, facilitating real-time data collection and control. These capabilities support critical applications such as process optimization, quality assurance, and predictive maintenance, making wireless sensors indispensable to modern industrial operations.
The market spans a wide range of product types, including flow sensors, light sensor networks, temperature sensors, gas sensors, humidity sensors, pressure sensors, level sensor networks, motion and position sensor networks, chemical sensor networks, and others. Among these, chemical sensor networks are expected to witness significant growth, with projections reaching USD 4.1 billion by 2034. These sensors are essential for industries such as oil and gas, pharmaceuticals, and food processing, where monitoring chemical compositions and detecting hazardous substances is paramount. Their wireless connectivity allows deployment in remote or hazardous locations, while advancements in miniaturization and adherence to stringent safety regulations further accelerate market expansion.
| Market Scope | |
|---|---|
| Start Year | 2024 |
| Forecast Year | 2025-2034 |
| Start Value | $5.9 Billion |
| Forecast Value | $19.8 Billion |
| CAGR | 12.9% |
Connectivity options in the industrial wireless sensor market include Wi-Fi, LoRaWAN, Bluetooth, Zigbee, Near Field Communication (NFC), WirelessHART, Cellular Network, and ISA 100.11a. LoRaWAN stands out as the fastest-growing segment, anticipated to grow at a CAGR of 15.7% during the forecast period. Its popularity stems from its suitability for long-range, low-power applications, such as remote monitoring in industries like oil and gas and agriculture. LoRaWAN's ability to transmit data over long distances while consuming minimal energy makes it ideal for large-scale IoT implementations, particularly in industries requiring extensive sensor networks.
The United States leads the industrial wireless sensor market, holding a dominant share of 82.2% in 2024. This leadership is driven by the rapid adoption of Industrial Internet of Things (IIoT) technologies, advanced manufacturing practices, and significant investments in automation and smart factory initiatives. Government incentives aimed at fostering industrial modernization further boost the market's growth. The U.S. also benefits from the presence of leading market players and robust technological infrastructure, which fuel innovation and drive the demand for energy-efficient solutions. Wireless sensors are becoming integral across diverse industries, solidifying their role in shaping the future of industrial operations.
Table of Contents
Chapter 1 Methodology & Scope
- 1.1 Market scope & definitions
- 1.2 Base estimates & calculations
- 1.3 Forecast calculations
- 1.4 Data sources
- 1.4.1 Primary
- 1.4.2 Secondary
- 1.4.2.1 Paid sources
- 1.4.2.2 Public sources
Chapter 2 Executive Summary
- 2.1 Industry synopsis, 2021-2034
Chapter 3 Industry Insights
- 3.1 Industry ecosystem analysis
- 3.1.1 Factor affecting the value chain
- 3.1.2 Profit margin analysis
- 3.1.3 Disruptions
- 3.1.4 Future outlook
- 3.1.5 Manufacturers
- 3.1.6 Distributors
- 3.2 Supplier landscape
- 3.3 Profit margin analysis
- 3.4 Key news & initiatives
- 3.5 Regulatory landscape
- 3.6 Impact forces
- 3.6.1 Growth drivers
- 3.6.1.1 Increasing adoption of industrial automation
- 3.6.1.2 Expansion of Industrial IoT (IIoT)
- 3.6.1.3 Advancements in wireless communication technologies
- 3.6.1.4 Rising focus on energy efficiency and sustainability
- 3.6.1.5 Increasing demand for remote monitoring and predictive maintenance
- 3.6.2 Industry pitfalls & challenges
- 3.6.2.1 Concerns over data security and privacy
- 3.6.2.2 High initial deployment costs and complexity
- 3.6.1 Growth drivers
- 3.7 Growth potential analysis
- 3.8 Porter’s analysis
- 3.9 PESTEL analysis
Chapter 4 Competitive Landscape, 2024
- 4.1 Introduction
- 4.2 Company market share analysis
- 4.3 Competitive positioning matrix
- 4.4 Strategic outlook matrix
Chapter 5 Market Estimates & Forecast, By Product Type, 2021-2034 (USD Billion & Units)
- 5.1 Key trends
- 5.2 Temperature sensor
- 5.3 Gas sensor
- 5.4 Pressure sensor
- 5.5 Humidity sensor
- 5.6 Flow sensor
- 5.7 Level sensor networks
- 5.8 Motion & position sensor networks
- 5.9 Light sensor networks
- 5.10 Chemical sensor networks
- 5.11 Other
Chapter 6 Market Estimates & Forecast, By Connectivity, 2021-2034 (USD Billion & Units)
- 6.1 Key trends
- 6.2 Wi-Fi
- 6.3 Bluetooth
- 6.4 LoRaWAN
- 6.5 Zigbee
- 6.6 Near Field Communication (NFC)
- 6.7 Cellular network
- 6.8 WirelessHART
- 6.9 ISA 100.11a
Chapter 7 Market Estimates & Forecast, By Application, 2021-2034 (USD Billion & Units)
- 7.1 Key trends
- 7.2 Machine monitoring
- 7.3 Asset tracking
- 7.4 Process control
- 7.5 Safety management
- 7.6 Predictive maintenance
- 7.7 Environmental monitoring
- 7.8 Others
Chapter 8 Market Estimates & Forecast, By End Use, 2021-2034 (USD Billion & Units)
- 8.1 Key trends
- 8.2 Automotive
- 8.3 Manufacturing
- 8.4 Oil & gas
- 8.5 Utilities
- 8.6 Mining
- 8.7 Others
Chapter 9 Market Estimates & Forecast, By Region, 2021-2034 (USD Billion & Units)
- 9.1 Key trends
- 9.2 North America
- 9.2.1 U.S.
- 9.2.2 Canada
- 9.3 Europe
- 9.3.1 UK
- 9.3.2 Germany
- 9.3.3 France
- 9.3.4 Italy
- 9.3.5 Spain
- 9.3.6 Russia
- 9.4 Asia Pacific
- 9.4.1 China
- 9.4.2 India
- 9.4.3 Japan
- 9.4.4 South Korea
- 9.4.5 Australia
- 9.5 Latin America
- 9.5.1 Brazil
- 9.5.2 Mexico
- 9.6 MEA
- 9.6.1 South Africa
- 9.6.2 Saudi Arabia
- 9.6.3 UAE
Chapter 10 Company Profiles
- 10.1 ABB Ltd.
- 10.2 Advantech Co., Ltd.
- 10.3 Analog Devices, Inc.
- 10.4 Banner Engineering Corp.
- 10.5 Beanair SAS
- 10.6 Bosch Sensortec GmbH
- 10.7 Digi International Inc.
- 10.8 Emerson Electric Co.
- 10.9 Endress+Hauser Group
- 10.10 General Electric Company
- 10.11 Honeywell International Inc.
- 10.12 Microchip Technology Inc.
- 10.13 Mitsubishi Electric Corporation
- 10.14 NXP Semiconductors N.V.
- 10.15 Omron Corporation
- 10.16 Pepperl+Fuchs SE
- 10.17 Rockwell Automation, Inc.
- 10.18 Schneider Electric SE
- 10.19 Sensata Technologies Holding PLC
- 10.20 Siemens AG
- 10.21 STMicroelectronics N.V.
- 10.22 TE Connectivity Ltd.
- 10.23 Texas Instruments Incorporated
- 10.24 Yokogawa Electric Corporation
