


 |
市场调查报告书
商品编码
1665437
低功耗下一代显示器市场机会、成长动力、产业趋势分析与 2025 - 2034 年预测Low Power Next Generation Display Market Opportunity, Growth Drivers, Industry Trend Analysis, and Forecast 2025 - 2034 |
||||||
2024 年全球低功耗下一代显示器市场价值为 1.32 亿美元,预计 2025 年至 2034 年的复合年增长率为 6.2%。这些发展满足了扩增实境(AR)和虚拟实境(VR)等应用对高解析度和节能显示器日益增长的需求。人工智慧和物联网与这些系统的整合进一步加速了创新,为各种设备提供了智慧和自适应功能。日益增强的环保意识和减少碳足迹的努力正在鼓励製造商和消费者采用节能解决方案,下一代显示器正在各个领域获得关注。
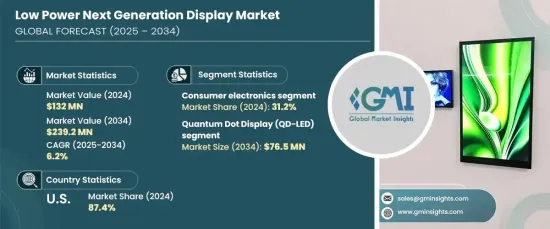
消费性电子产品将成为2024年的主要应用领域,占据31.2%的市场。智慧型手机、平板电脑、笔记型电脑和穿戴式装置等装置是这一领域成长的主要贡献者,因为它们优先考虑延长电池寿命和卓越的显示品质。 OLED、MicroLED 和电子纸技术在提供生动的视觉效果同时降低能耗方面发挥关键作用。可折迭和灵活设计的转变也刺激了需求,创新的形式满足了消费者对便携性和功能性的期望。 5G 网路和物联网设备的日益普及确保了该领域的持续扩张。
| 市场范围 | |
|---|---|
| 起始年份 | 2024 |
| 预测年份 | 2025-2034 |
| 起始值 | 1.32亿美元 |
| 预测值 | 2.392亿美元 |
| 复合年增长率 | 6.2% |
量子点显示器(QD-LED)的技术进步使其成为市场上的重要参与者。预计到 2034 年将创造 7,650 万美元的收入,这些显示器具有出色的色彩精度、亮度和能源效率。量子点能够实现精确的发光,在色彩范围和性能方面优于传统的 LCD 和 OLED。这些特性使得 QD-LED 显示器在电视和显示器等高阶电子产品中备受追捧,同时其低能耗要求满足了对永续解决方案日益增长的需求。
美国在2024年引领北美低功耗下一代显示器市场,占该地区营收的87.4%。这种主导地位源自于强劲的消费性电子产业和尖端的研究和发展。 OLED 和 MicroLED 等先进显示技术广泛应用于智慧电视、智慧型手机和汽车显示器等应用。汽车领域,尤其是电动车领域越来越多地采用节能解决方案,凸显了低功耗显示器对于资讯娱乐和平视系统的重要性。此外,物联网和人工智慧与家用电器和工业应用的整合持续推动市场需求,巩固了美国在创新和技术进步方面的领先地位。
目录
第 1 章:方法论与范围
- 市场范围和定义
- 基础估算与计算
- 预测计算
- 资料来源
- 基本的
- 次要
- 付费来源
- 公共资源
第 2 章:执行摘要
第 3 章:产业洞察
- 产业生态系统分析
- 影响价值链的因素
- 利润率分析
- 中断
- 未来展望
- 製造商
- 经销商
- 供应商概况
- 利润率分析
- 重要新闻及倡议
- 监管格局
- 衝击力
- 成长动力
- 显示技术的进步
- 节能消费电子产品的需求
- 扩大在穿戴式装置的应用
- 在工业和医疗保健领域的应用日益广泛
- 产业陷阱与挑战
- 生产成本高
- 寿命有限且耐用性问题
- 成长动力
- 成长潜力分析
- 波特的分析
- PESTEL 分析
第四章:竞争格局
- 介绍
- 公司市占率分析
- 竞争定位矩阵
- 战略展望矩阵
第 5 章:市场估计与预测:按技术,2021 年至 2034 年
- 主要趋势
- 量子点显示器(QD-LED)
- 场发射显示器 (FED)
- 雷射萤光显示器 (LPD)
- 有机发光二极体 (OLED)
- 有机发光电晶体 (OLET)
- 表面传导电子发射显示器 (SED)
第 6 章:市场估计与预测:按应用,2021 年至 2034 年
- 主要趋势
- 消费性电子产品
- 家电
- 广告
- 公开展示
- 自动化
- 航空
第 7 章:市场估计与预测:按地区,2021 年至 2034 年
- 主要趋势
- 北美洲
- 我们
- 加拿大
- 欧洲
- 英国
- 德国
- 法国
- 义大利
- 西班牙
- 俄罗斯
- 亚太地区
- 中国
- 印度
- 日本
- 韩国
- 澳洲
- 拉丁美洲
- 巴西
- 墨西哥
- 中东及非洲
- 南非
- 沙乌地阿拉伯
- 阿联酋
第八章:公司简介
- AU Optronics Corporation
- AUO Corporation
- BOE Technology Group Co., Ltd.
- Doosan Group
- DuPont de Nemours, Inc.
- Futaba Corporation
- LG Display Co., Ltd.
- Nanosys, Inc.
- Novaled GmbH
- Panasonic Corporation
- Philips International BV
- Planar Systems, Inc.
- QUALCOMM Incorporated
- RitDisplay Corporation
- Samsung Electronics Co., Ltd.
- Sharp Corporation
- Sony Corporation
- Tianma Microelectronics Co., Ltd.
- Universal Display Corporation (UDC)
- Visionox Technology, Inc.
The Global Low Power Next Generation Display Market, valued at USD 132 million in 2024, is projected to grow at a CAGR of 6.2% from 2025 to 2034. Advancements in display technology are driving this growth, with significant progress in OLED and MicroLED systems enhancing pixel density, color fidelity, and responsiveness while reducing energy demands. These developments cater to the increasing need for high-resolution and energy-efficient displays in applications like augmented reality (AR) and virtual reality (VR). The integration of AI and IoT into these systems is further accelerating innovation, offering intelligent and adaptive features for a wide range of devices. Rising environmental consciousness and efforts to reduce carbon footprints are encouraging both manufacturers and consumers to adopt energy-efficient solutions, with next-generation displays gaining traction across various sectors.
Consumer electronics emerged as the leading application area in 2024, capturing 31.2% of the market. Devices such as smartphones, tablets, laptops, and wearables are key contributors to this segment's growth, as they prioritize extended battery life and superior display quality. OLED, MicroLED, and e-paper technologies play a pivotal role in delivering vibrant visuals while minimizing energy consumption. The shift toward foldable and flexible designs has also fueled demand, with innovative formats meeting consumer expectations for portability and functionality. The growing adoption of 5G networks and IoT-enabled devices ensures the continued expansion of this segment.
| Market Scope | |
|---|---|
| Start Year | 2024 |
| Forecast Year | 2025-2034 |
| Start Value | $132 million |
| Forecast Value | $239.2 million |
| CAGR | 6.2% |
Technological advancements in Quantum Dot Displays (QD-LED) have positioned them as a prominent player in the market. Expected to generate USD 76.5 million in revenue by 2034, these displays offer exceptional color accuracy, brightness, and energy efficiency. Quantum dots enable precise light emission, outperforming traditional LCDs and OLEDs in terms of color range and performance. These features make QD-LED displays highly sought after in premium electronics, including televisions and monitors, while their low energy requirements address the rising demand for sustainable solutions.
The United States led the North American low-power next-generation display market in 2024, accounting for 87.4% of the region's revenue. This dominance stems from a robust consumer electronics industry and cutting-edge research and development. Advanced display technologies like OLED and MicroLED are widely integrated across applications such as smart TVs, smartphones, and automotive displays. The growing adoption of energy-efficient solutions in the automotive sector, particularly in electric vehicles, underscores the importance of low-power displays for infotainment and heads-up systems. Additionally, the integration of IoT and AI into home appliances and industrial applications continues to propel market demand, reinforcing the US as a leader in innovation and technological advancement.
Table of Contents
Chapter 1 Methodology & Scope
- 1.1 Market scope & definitions
- 1.2 Base estimates & calculations
- 1.3 Forecast calculations
- 1.4 Data sources
- 1.4.1 Primary
- 1.4.2 Secondary
- 1.4.2.1 Paid sources
- 1.4.2.2 Public sources
Chapter 2 Executive Summary
- 2.1 Industry synopsis, 2021-2034
Chapter 3 Industry Insights
- 3.1 Industry ecosystem analysis
- 3.1.1 Factor affecting the value chain
- 3.1.2 Profit margin analysis
- 3.1.3 Disruptions
- 3.1.4 Future outlook
- 3.1.5 Manufacturers
- 3.1.6 Distributors
- 3.2 Supplier landscape
- 3.3 Profit margin analysis
- 3.4 Key news & initiatives
- 3.5 Regulatory landscape
- 3.6 Impact forces
- 3.6.1 Growth drivers
- 3.6.1.1 Advancements in display technology
- 3.6.1.2 Demand for energy-efficient consumer electronics
- 3.6.1.3 Expanding application in wearable devices
- 3.6.1.4 Growing adoption in industrial and healthcare applications
- 3.6.2 Industry pitfalls & challenges
- 3.6.2.1 High production costs
- 3.6.2.2 Limited longevity and durability concerns
- 3.6.1 Growth drivers
- 3.7 Growth potential analysis
- 3.8 Porter’s analysis
- 3.9 PESTEL analysis
Chapter 4 Competitive Landscape, 2024
- 4.1 Introduction
- 4.2 Company market share analysis
- 4.3 Competitive positioning matrix
- 4.4 Strategic outlook matrix
Chapter 5 Market Estimates & Forecast, By Technology, 2021-2034 (USD Million)
- 5.1 Key trends
- 5.2 Quantum Dot Display (QD-LED)
- 5.3 Field Emission Display (FED)
- 5.4 Laser Phosphor Display (LPD)
- 5.5 Organic Light-Emitting Diode (OLED)
- 5.6 Organic Light-Emitting Transistor (OLET)
- 5.7 Surface-Conduction Electron-Emitter Display (SED)
Chapter 6 Market Estimates & Forecast, By Application, 2021-2034 (USD Million)
- 6.1 Key trends
- 6.2 Consumer electronics
- 6.3 Home appliances
- 6.4 Advertising
- 6.5 Public display
- 6.6 Automation
- 6.7 Aviation
Chapter 7 Market Estimates & Forecast, By Region, 2021-2034 (USD Million)
- 7.1 Key trends
- 7.2 North America
- 7.2.1 U.S.
- 7.2.2 Canada
- 7.3 Europe
- 7.3.1 UK
- 7.3.2 Germany
- 7.3.3 France
- 7.3.4 Italy
- 7.3.5 Spain
- 7.3.6 Russia
- 7.4 Asia Pacific
- 7.4.1 China
- 7.4.2 India
- 7.4.3 Japan
- 7.4.4 South Korea
- 7.4.5 Australia
- 7.5 Latin America
- 7.5.1 Brazil
- 7.5.2 Mexico
- 7.6 MEA
- 7.6.1 South Africa
- 7.6.2 Saudi Arabia
- 7.6.3 UAE
Chapter 8 Company Profiles
- 8.1 AU Optronics Corporation
- 8.2 AUO Corporation
- 8.3 BOE Technology Group Co., Ltd.
- 8.4 Doosan Group
- 8.5 DuPont de Nemours, Inc.
- 8.6 Futaba Corporation
- 8.7 LG Display Co., Ltd.
- 8.8 Nanosys, Inc.
- 8.9 Novaled GmbH
- 8.10 Panasonic Corporation
- 8.11 Philips International B.V.
- 8.12 Planar Systems, Inc.
- 8.13 QUALCOMM Incorporated
- 8.14 RitDisplay Corporation
- 8.15 Samsung Electronics Co., Ltd.
- 8.16 Sharp Corporation
- 8.17 Sony Corporation
- 8.18 Tianma Microelectronics Co., Ltd.
- 8.19 Universal Display Corporation (UDC)
- 8.20 Visionox Technology, Inc.


