


 |
市场调查报告书
商品编码
1666586
智慧瓦斯表市场机会、成长动力、产业趋势分析及 2025 - 2034 年预测Smart Gas Meters Market Opportunity, Growth Drivers, Industry Trend Analysis, and Forecast 2025 - 2034 |
||||||
2024 年全球智慧瓦斯表市场价值为 73 亿美元,预计 2025 年至 2034 年期间将以 17.3% 的复合年增长率大幅增长。随着优化能源管理的需求不断增长,智慧燃气表对于公用事业提高营运效率和降低能源消耗变得至关重要。物联网技术的集成,加上即时资料收集和远端监控的进步,大大提高了这些设备的功能。世界各国政府也在推动节能,进一步推动市场扩张,因为智慧瓦斯表在实现永续发展目标方面发挥着至关重要的作用。
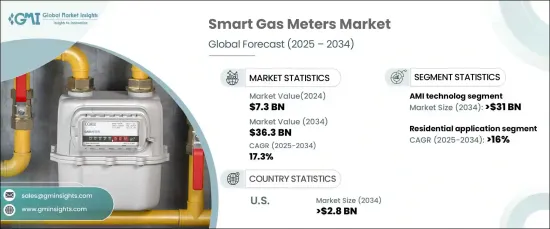
由于确保无缝资料传输的尖端通讯技术的广泛使用,AMI 领域的规模预计到 2034 年将超过 310 亿美元。此外,人工智慧驱动的分析和物联网整合正在重塑能源资料的收集、处理和分析方式。这些技术可以实现预测性维护、即时监控和更高精度的能源管理,为公用事业公司提供改进的决策工具和更详细的能源消耗模式洞察。随着公用事业公司采用这些技术进步,他们可以更有效地管理和分配资源,最终提高电网可靠性并减少能源浪费。
| 市场范围 | |
|---|---|
| 起始年份 | 2024 |
| 预测年份 | 2025-2034 |
| 起始值 | 73亿美元 |
| 预测值 | 363亿美元 |
| 复合年增长率 | 17.3% |
预计未来十年住宅产业将实现令人瞩目的成长,年增率将超过16%。这一趋势很大程度上是由消费者对节能解决方案日益增长的需求以及对能源消耗即时资料日益增长的需求所推动的。由于企业注重改善资源管理和降低成本,商业应用也受惠于智慧电錶的实施。公用事业公司越来越多地将智慧电錶整合到智慧电网中,优化能源分配并最大限度地减少电力损耗。减少能源消耗和促进永续发展的监管压力是加速采用智慧计量解决方案的另一个关键因素。
在美国,智慧燃气表市场规模预计到 2034 年将超过 28 亿美元。公用事业公司越来越多地为客户提供更清晰的能源使用情况,促进需求面管理策略,并改善以客户为中心的服务。此外,旨在促进能源节约和智慧电网系统发展的州和联邦法规正在加速全国智慧燃气表的部署。
目录
第 1 章:方法论与范围
- 市场定义
- 基础估算与计算
- 预测计算
- 资料来源
- 基本的
- 次要
- 有薪资的
- 民众
第 2 章:执行摘要
第 3 章:产业洞察
- 产业生态系统分析
- 监管格局
- 产业衝击力
- 成长动力
- 产业陷阱与挑战
- 成长潜力分析
- 波特的分析
- 供应商的议价能力
- 买家的议价能力
- 新进入者的威胁
- 替代品的威胁
- PESTEL 分析
第四章:竞争格局
- 战略仪表板
- 创新与永续发展格局
第 5 章:市场规模及预测:依技术分类,2021 – 2034 年
- 主要趋势
- 急性心肌梗塞
- 抗凝血
第 6 章:市场规模与预测:按应用,2021 – 2034 年
- 主要趋势
- 住宅
- 商业的
- 公用事业
第 7 章:市场规模及预测:按地区,2021 – 2034 年
- 主要趋势
- 北美洲
- 我们
- 加拿大
- 欧洲
- 德国
- 英国
- 法国
- 瑞典
- 义大利
- 亚太地区
- 中国
- 日本
- 印度
- 韩国
- 澳洲
- 中东和非洲
- 阿联酋
- 沙乌地阿拉伯
- 南非
- 埃及
- 拉丁美洲
- 巴西
- 墨西哥
- 阿根廷
第八章:公司简介
- Aclara Technologies
- Apator
- Azbil Kimmon
- Chint Group
- Honeywell International
- Itron
- Landis+Gyr
- Neptune Technology Group
- Osaki Electric
- Raychem RPG
- Schneider Electric
- Sensus
- Wasion Group
- Zenner International
The Global Smart Gas Meters Market was valued at USD 7.3 billion in 2024 and is expected to grow significantly at a CAGR of 17.3% between 2025 and 2034. This growth is primarily driven by the rising demand for energy-efficient solutions and the growing adoption of advanced metering infrastructure (AMI) across various industries. With the increasing need for optimized energy management, smart gas meters are becoming essential for utilities to enhance operational efficiency and reduce energy consumption. The integration of IoT technologies, coupled with advancements in real-time data collection and remote monitoring, is significantly improving the capabilities of these devices. Governments worldwide are also pushing for energy conservation, further driving market expansion as smart gas meters play a vital role in meeting sustainability goals.
The AMI segment is projected to surpass USD 31 billion by 2034, fueled by the widespread use of cutting-edge communication technologies that ensure seamless data transmission. Additionally, the incorporation of AI-driven analytics and IoT integration is reshaping the way energy data is collected, processed, and analyzed. These technologies enable predictive maintenance, real-time monitoring, and greater accuracy in energy management, offering utilities improved decision-making tools and more detailed insights into energy consumption patterns. As utilities embrace these technological advances, they can more effectively manage and distribute resources, ultimately enhancing grid reliability and reducing energy wastage.
| Market Scope | |
|---|---|
| Start Year | 2024 |
| Forecast Year | 2025-2034 |
| Start Value | $7.3 Billion |
| Forecast Value | $36.3 Billion |
| CAGR | 17.3% |
The residential sector is expected to witness impressive growth over the next decade, with an annual growth rate surpassing 16%. This trend is largely fueled by the increasing consumer demand for energy-efficient solutions, as well as a growing desire for real-time data on energy consumption. Commercial applications are also benefiting from the implementation of smart meters as businesses focus on improving resource management and reducing costs. Utilities are increasingly integrating smart meters into smart grids, optimizing energy distribution, and minimizing power losses. Regulatory pressures to reduce energy consumption and promote sustainability are another key factor accelerating the adoption of smart metering solutions.
In the U.S., the smart gas meters market is expected to surpass USD 2.8 billion by 2034. This growth is being propelled by ongoing technological advancements, strong regulatory support, and a shift toward greater energy efficiency. Utilities are increasingly offering customers enhanced visibility into their energy usage, promoting demand-side management strategies, and improving customer-centric services. Additionally, state and federal regulations aimed at advancing energy conservation and the development of smart grid systems are accelerating the deployment of smart gas meters across the country.
Table of Contents
Chapter 1 Methodology & Scope
- 1.1 Market definitions
- 1.2 Base estimates & calculations
- 1.3 Forecast calculation
- 1.4 Data sources
- 1.4.1 Primary
- 1.4.2 Secondary
- 1.4.2.1 Paid
- 1.4.2.2 Public
Chapter 2 Executive Summary
- 2.1 Industry synopsis, 2021 - 2034
Chapter 3 Industry Insights
- 3.1 Industry ecosystem analysis
- 3.2 Regulatory landscape
- 3.3 Industry impact forces
- 3.3.1 Growth drivers
- 3.3.2 Industry pitfalls & challenges
- 3.4 Growth potential analysis
- 3.5 Porter's analysis
- 3.5.1 Bargaining power of suppliers
- 3.5.2 Bargaining power of buyers
- 3.5.3 Threat of new entrants
- 3.5.4 Threat of substitutes
- 3.6 PESTEL analysis
Chapter 4 Competitive Landscape, 2024
- 4.1 Strategic dashboard
- 4.2 Innovation & sustainability landscape
Chapter 5 Market Size and Forecast, By Technology, 2021 – 2034 (USD Million, ‘000 Units)
- 5.1 Key trends
- 5.2 AMI
- 5.3 AMR
Chapter 6 Market Size and Forecast, By Application, 2021 – 2034 (USD Million, ‘000 Units)
- 6.1 Key trends
- 6.2 Residential
- 6.3 Commercial
- 6.4 Utility
Chapter 7 Market Size and Forecast, By Region, 2021 – 2034 (USD Million, ‘000 Units)
- 7.1 Key trends
- 7.2 North America
- 7.2.1 U.S.
- 7.2.2 Canada
- 7.3 Europe
- 7.3.1 Germany
- 7.3.2 UK
- 7.3.3 France
- 7.3.4 Sweden
- 7.3.5 Italy
- 7.4 Asia Pacific
- 7.4.1 China
- 7.4.2 Japan
- 7.4.3 India
- 7.4.4 South Korea
- 7.4.5 Australia
- 7.5 Middle East & Africa
- 7.5.1 UAE
- 7.5.2 Saudi Arabia
- 7.5.3 South Africa
- 7.5.4 Egypt
- 7.6 Latin America
- 7.6.1 Brazil
- 7.6.2 Mexico
- 7.6.3 Argentina
Chapter 8 Company Profiles
- 8.1 Aclara Technologies
- 8.2 Apator
- 8.3 Azbil Kimmon
- 8.4 Chint Group
- 8.5 Honeywell International
- 8.6 Itron
- 8.7 Landis+Gyr
- 8.8 Neptune Technology Group
- 8.9 Osaki Electric
- 8.10 Raychem RPG
- 8.11 Schneider Electric
- 8.12 Sensus
- 8.13 Wasion Group
- 8.14 Zenner International
 智慧瓦斯表市场报告,按组件(硬体、软体)、类型(自动计量基础设施 (AMI)、自动抄表 (AMR))、最终用途(住宅、商业、工业)和地区划分,2025 年至 2033 年
 智慧燃气表市场规模、份额和成长分析(按组件、类型、技术、最终用户和地区)- 2025-2032 年产业预测
 2025 年全球智慧燃气表市场报告
 智慧燃气表:市场占有率分析、产业趋势与统计、成长预测(2025-2030 年)
 全球智慧燃气表市场:按组件、类型、使用的技术、应用和最终用途 - 预测 2025-2030
 智慧燃气表市场规模、份额、趋势分析报告:按组件、按类型、按技术、按最终用途、按地区、细分市场预测,2024-2030 年
 2024-2028年全球智慧燃气表市场
 全球智慧瓦斯表市场 - 2024-2031住宅智慧瓦斯表市场规模 - 按技术(AMI、AMR)、区域展望、竞争市场份额和预测,2024 年 - 2032 年
 智慧型燃气表的全球市场:市场占有率与排行榜,整体销售额,需求预测(2024年~2030年)