


 |
市场调查报告书
商品编码
1666947
酚类抗氧化剂市场机会、成长动力、产业趋势分析及 2025 - 2034 年预测Phenolic Antioxidants Market Opportunity, Growth Drivers, Industry Trend Analysis, and Forecast 2025 - 2034 |
||||||
2024 年全球酚类抗氧化剂市场规模达到 46 亿美元,预计 2025 年至 2034 年期间复合年增长率将达到 5.8%。它们能够增强产品稳定性、延长保质期并改善性能,已成为现代製造业必不可少的原料。随着消费者在日常选择中越来越多地寻求更安全和更环保的选择,对天然、清洁标籤和永续产品的需求不断增长,进一步推动了市场的发展。这一趋势强调了酚类抗氧化剂在满足不断变化的消费者偏好和工业需求方面日益增长的重要性。
市场对天然酚类抗氧化剂的偏好不断增长,推动了市场的发展,预计到 2034 年将产生 58 亿美元的产值,复合年增长率为 5.4%。来自植物(包括草药、香料和水果)的天然抗氧化剂因符合健康、永续性和无毒成分趋势而广泛采用。随着消费者优先考虑健康益处和环保产品,对这些植物解决方案的需求持续上升。这种转变反映了人们越来越倾向于使用天然保健产品,强调清洁标籤成分,以满足现代人对整体健康和生态意识的重视。
| 市场范围 | |
|---|---|
| 起始年份 | 2024 |
| 预测年份 | 2025-2034 |
| 起始值 | 46亿美元 |
| 预测值 | 81亿美元 |
| 复合年增长率 | 5.8% |
单功能抗氧化剂在 2024 年占据市场主导地位,占有 44.3% 的份额,创收 21 亿美元。这些抗氧化剂因其防止氧化和延长产品保质期的能力而受到重视,预计在预测期内的复合年增长率为 5.2%。然而,对双功能抗氧化剂的需求正在加速成长,因为其具有防止氧化和紫外线伤害的双重功效,在化妆品和製药行业中尤为受重视。同时,多功能抗氧化剂也越来越受到人们的青睐,因为它们具有抗衰老、耐腐蚀和防腐等多种优点,满足了不同应用对多功能高效解决方案的需求。
到 2034 年,美国酚类抗氧化剂市场规模预计将达到 21 亿美元,复合年增长率为 4.9%。食品饮料、个人护理和工业领域不断增长的需求推动了这一成长。在食品业,消费者正在转向天然成分,青睐植物性产品和清洁标籤产品。同时,化妆品行业正在采用先进的抗氧化剂来满足日益增长的抗衰老和皮肤保护解决方案的需求。预计这些趋势将在未来几年维持美国市场的强劲成长,巩固其在全球市场的重要地位。
目录
第 1 章:方法论与范围
- 市场范围和定义
- 基础估算与计算
- 预测计算
- 资料来源
- 基本的
- 次要
- 付费来源
- 公共资源
第 2 章:执行摘要
第 3 章:产业洞察
- 产业生态系统分析
- 影响价值链的因素
- 利润率分析
- 中断
- 未来展望
- 製造商
- 经销商
- 供应商概况
- 利润率分析
- 重要新闻及倡议
- 监管格局
- 衝击力
- 产业衝击力
- 成长动力
- 食品饮料产业需求不断成长
- 扩大化妆品和个人护理产品的应用
- 不断增长的汽车和工业应用
- 市场挑战
- 与化学品使用相关的环境和监管问题
- 成长动力
- 法规和市场影响
- 波特的分析
- PESTEL 分析
第四章:竞争格局
- 介绍
- 公司市占率分析
- 竞争定位矩阵
- 战略展望矩阵
第 5 章:市场规模与预测:按来源,2021-2034 年
- 主要趋势
- 自然的
- 合成的
第 6 章:市场规模与预测:按类型,2021-2034 年
- 主要趋势
- 单功能
- 双功能
- 多功能的
第 7 章:市场规模与预测:依形式,2021-2034 年
- 主要趋势
- 液体
- 颗粒
- 粉末
第 8 章:市场规模与预测:按应用,2021-2034 年
- 主要趋势
- 塑胶和橡胶
- 燃料和润滑油
- 化妆品和个人护理
- 食品及饲料添加剂
- 其他的
第 9 章:市场规模与预测:按地区,2021-2034 年
- 主要趋势
- 北美洲
- 我们
- 加拿大
- 欧洲
- 英国
- 德国
- 法国
- 义大利
- 西班牙
- 俄罗斯
- 亚太地区
- 中国
- 印度
- 日本
- 韩国
- 澳洲
- 拉丁美洲
- 巴西
- 墨西哥
- 中东及非洲
- 南非
- 沙乌地阿拉伯
- 阿联酋
第十章:公司简介
- Afton Chemical
- Adeka Corporation
- Addivant
- BASF SE
- Chitec
- Clariant International AG
- Dorf Ketal
- Dover Chem
- Eastman Chemical Company
- Lanxess AG
- Lubrizol Corporation
- Mayzo Inc
- OXIRIS
- SI Group
- Songwon Industrial
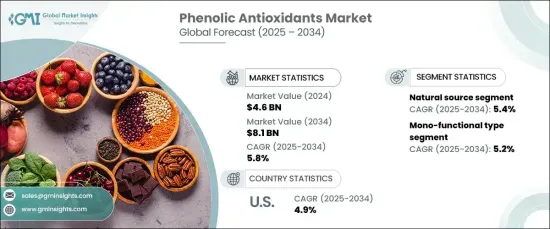
The Global Phenolic Antioxidants Market reached USD 4.6 billion in 2024 and is projected to grow at an impressive CAGR of 5.8% from 2025 to 2034. Phenolic antioxidants play a critical role in protecting products from oxidative damage, making them indispensable across industries such as food, cosmetics, and pharmaceuticals. Their ability to enhance product stability, extend shelf life, and improve performance has positioned them as essential ingredients in modern manufacturing. The growing demand for natural, clean-label, and sustainable products has further propelled the market, as consumers increasingly seek safer and eco-friendly options in their everyday choices. This trend underscores the expanding importance of phenolic antioxidants in addressing evolving consumer preferences and industrial needs.
The market's momentum is fueled by the surging preference for natural phenolic antioxidants, expected to generate USD 5.8 billion by 2034 with a CAGR of 5.4%. Natural antioxidants derived from plants, including herbs, spices, and fruits, are gaining widespread adoption due to their alignment with wellness, sustainability, and non-toxic ingredient trends. As consumers prioritize health benefits and environmentally responsible products, the demand for these plant-based solutions continues to rise. This transition reflects the broader movement toward natural health products, emphasizing clean-label ingredients that cater to the modern emphasis on holistic well-being and ecological consciousness.
| Market Scope | |
|---|---|
| Start Year | 2024 |
| Forecast Year | 2025-2034 |
| Start Value | $4.6 Billion |
| Forecast Value | $8.1 Billion |
| CAGR | 5.8% |
Mono-functional antioxidants dominated the market in 2024 with a commanding 44.3% share, generating USD 2.1 billion. These antioxidants, valued for their ability to prevent oxidation and prolong product longevity, are expected to grow at a CAGR of 5.2% during the forecast period. However, the demand for bi-functional antioxidants is accelerating, driven by their dual capabilities, such as protecting against oxidation and UV damage, which are particularly valued in the cosmetics and pharmaceutical industries. Meanwhile, multi-functional antioxidants are gaining traction as they offer a combination of benefits, including anti-aging properties, corrosion resistance, and preservation, meeting the need for versatile and efficient solutions across diverse applications.
The U.S. phenolic antioxidants market is set to reach USD 2.1 billion by 2034, growing at a CAGR of 4.9%. Increasing demand across the food and beverage, personal care, and industrial sectors is driving this growth. In the food industry, consumers are shifting toward natural ingredients, favoring plant-based and clean-label products. Concurrently, the cosmetics sector is embracing advanced antioxidants to cater to the rising demand for anti-aging and skin protection solutions. These trends are expected to sustain robust growth in the U.S. market over the coming years, solidifying its position as a key player in the global landscape.
Table of Contents
Chapter 1 Methodology & Scope
- 1.1 Market scope & definition
- 1.2 Base estimates & calculations
- 1.3 Forecast calculation
- 1.4 Data sources
- 1.4.1 Primary
- 1.4.2 Secondary
- 1.4.2.1 Paid sources
- 1.4.2.2 Public sources
Chapter 2 Executive Summary
- 2.1 Industry synopsis, 2021-2034
Chapter 3 Industry Insights
- 3.1 Industry ecosystem analysis
- 3.1.1 Factor affecting the value chain
- 3.1.2 Profit margin analysis
- 3.1.3 Disruptions
- 3.1.4 Future outlook
- 3.1.5 Manufacturers
- 3.1.6 Distributors
- 3.2 Supplier landscape
- 3.3 Profit margin analysis
- 3.4 Key news & initiatives
- 3.5 Regulatory landscape
- 3.6 Impact forces
- 3.7 Industry impact forces
- 3.7.1 Growth drivers
- 3.7.1.1 Rising Demand in Food and Beverage Industry
- 3.7.1.2 Expanding Cosmetic and Personal Care Applications
- 3.7.1.3 Growing automotive and industrial applications
- 3.7.2 Market challenges
- 3.7.2.1 Environmental and regulatory concerns related to chemical usage
- 3.7.1 Growth drivers
- 3.8 Regulations & market impact
- 3.9 Porter’s analysis
- 3.10 PESTEL analysis
Chapter 4 Competitive Landscape, 2024
- 4.1 Introduction
- 4.2 Company market share analysis
- 4.3 Competitive positioning matrix
- 4.4 Strategic outlook matrix
Chapter 5 Market Size and Forecast, By Source, 2021-2034 (USD Billion) (Kilo Tons)
- 5.1 Key trends
- 5.2 Natural
- 5.3 Synthetic
Chapter 6 Market Size and Forecast, By Type, 2021-2034 (USD Billion) (Kilo Tons)
- 6.1 Key trends
- 6.2 Mono-functional
- 6.3 Bi-functional
- 6.4 Multi-functional
Chapter 7 Market Size and Forecast, By Form, 2021-2034 (USD Billion) (Kilo Tons)
- 7.1 Key trends
- 7.2 Liquid
- 7.3 Granule
- 7.4 Powder
Chapter 8 Market Size and Forecast, By Application, 2021-2034 (USD Billion) (Kilo Tons)
- 8.1 Key trends
- 8.2 Plastic & rubber
- 8.3 Fuel & lubricants
- 8.4 Cosmetic & personal care
- 8.5 Food & feed additive
- 8.6 Others
Chapter 9 Market Size and Forecast, By Region, 2021-2034 (USD Billion) (Kilo Tons)
- 9.1 Key trends
- 9.2 North America
- 9.2.1 U.S.
- 9.2.2 Canada
- 9.3 Europe
- 9.3.1 UK
- 9.3.2 Germany
- 9.3.3 France
- 9.3.4 Italy
- 9.3.5 Spain
- 9.3.6 Russia
- 9.4 Asia Pacific
- 9.4.1 China
- 9.4.2 India
- 9.4.3 Japan
- 9.4.4 South Korea
- 9.4.5 Australia
- 9.5 Latin America
- 9.5.1 Brazil
- 9.5.2 Mexico
- 9.6 MEA
- 9.6.1 South Africa
- 9.6.2 Saudi Arabia
- 9.6.3 UAE
Chapter 10 Company Profiles
- 10.1 Afton Chemical
- 10.2 Adeka Corporation
- 10.3 Addivant
- 10.4 BASF SE
- 10.5 Chitec
- 10.6 Clariant International AG
- 10.7 Dorf Ketal
- 10.8 Dover Chem
- 10.9 Eastman Chemical Company
- 10.10 Lanxess AG
- 10.11 Lubrizol Corporation
- 10.12 Mayzo Inc
- 10.13 OXIRIS
- 10.14 SI Group
- 10.15 Songwon Industrial
 氨基酚市场分析及预测(2034年):类型、产品、应用、技术、组件、最终用户、流程、功能、安装类型、设备
 按生产流程和应用分類的壬烯市场 - 全球预测 2025-2032
 苯酚衍生物市场-全球产业规模、份额、趋势、机会与预测,依衍生物、应用、地区与竞争细分,2020-2030 年
 苯酚衍生物市场:依衍生物、应用及地区划分全球氨基酚市场
 2025年全球氨基酚市场报告
 全球苯酚市场需求分析(按类型、应用及 2034 年预测)2032 年对氨基苯酚预测:按形态、等级、销售管道、应用和地区进行的全球分析苯酚市场:2025 年至 2032 年全球产业分析、规模、份额、成长、趋势与预测
 4,4'-硫代双-(2-叔丁基-5-甲基酚)的全球市场:2025年