


 |
市场调查报告书
商品编码
1913376
货车市场:市场机会、成长驱动因素、产业趋势分析及预测(2026-2035)Cargo Vans Market Opportunity, Growth Drivers, Industry Trend Analysis, and Forecast 2026 - 2035 |
||||||
全球货车市场预计到 2025 年价值 927 亿美元,到 2035 年将达到 1,529 亿美元,年复合成长率为 5.1%。
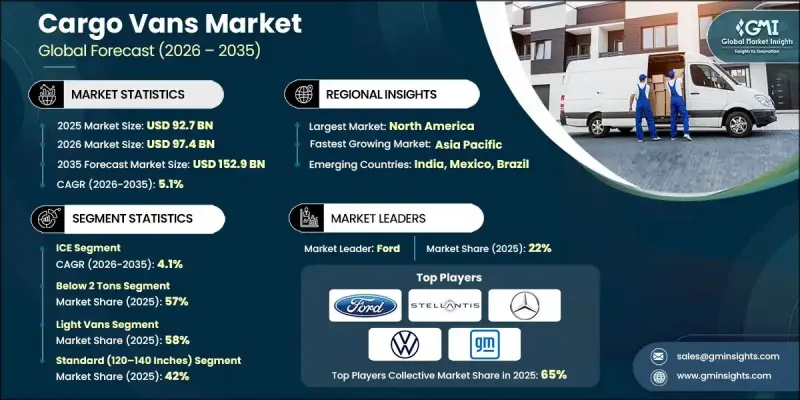
都市区物流活动的稳定成长以及全球对高效商务传输解决方案日益增长的需求,是推动市场扩张的主要动力。电子商务平台、零售分销网络和服务业的快速发展,显着提升了都市区和郊区对货车运输的需求。小包裹量的增加和车辆正常运作的延长,促使物流业者投资可靠且经济高效的车辆。同时,提高燃油效率和减少排放气体的监管压力,也影响车辆的更新换代週期,促使营运商引进性能更佳、营运成本更低的新型货车。车辆设计、动力传动系统技术和耐用性的不断进步,进一步提升了货车的可靠性和运作。随着城市不断扩张,最后一公里配送的重要性日益凸显,货车已成为现代交通物流生态系统中不可或缺的关键组成部分,支撑着各地区市场的持续成长。
| 市场覆盖范围 | |
|---|---|
| 开始年份 | 2025 |
| 预测期 | 2026-2035 |
| 初始市场规模 | 927亿美元 |
| 市场规模预测 | 1529亿美元 |
| 复合年增长率 | 5.1% |
预计到2025年,载重小于2吨的货车市占率将达到57.4%,并在2026年至2035年间以4.7%的复合年增长率成长。该负载容量级别的货车因其机动性强、效率高、载货能力充足,被广泛用于最后一公里配送和服务运营。它们能够在满足日常配送需求的同时,在人口密集的城市环境中高效运作,这也持续支撑着它们的高普及率。
到2025年,轴距在120至140英吋之间的标准货车将占据42%的市场。这些车辆兼具良好的载货空间和操控性,因此在区域和多点配送路线中广受欢迎。这种配置有助于物流营运商有效规划路线并最大限度地提高车队运转率。
预计到 2025 年,美国货车市场将占据 88.5% 的市场份额,市场规模将达到 265 亿美元。物流、履约和酒店业的快速扩张正在推动需求,促使企业对其商用车辆车队进行现代化改造和扩充。
目录
第一章:分析方法和范围
第二章执行摘要
第三章业界考察
- 产业生态系分析
- 供应商情况
- 利润率分析
- 成本结构
- 每个阶段的附加价值
- 影响价值链的因素
- 中断
- 产业影响因素
- 司机
- 城市物流和最后一公里配送的成长
- 电子商务与有组织零售业的兴起
- 车队更新和效率提升
- 引入替代动力传动系统
- 产业潜在风险与挑战
- 高额的车辆购置成本
- 都市区拥挤和停车位有限
- 市场机会
- 商用车电气化
- 低温运输和特种物流领域的成长
- 在新兴市场拓展业务
- 司机
- 成长潜力分析
- 监管环境
- 北美洲
- 联邦汽车运输安全管理局 (FMCSA) 法规
- 美国环保署(EPA)排放标准
- 加州空气资源委员会(CARB)法规
- 欧洲
- 欧盟商用车法规
- 欧6排放气体法规
- 通用安全规程 (GSR)
- 欧盟型式认可框架
- 数位式行车记录器法规
- 低排放区(LEZ)和零排放区(ZEZ)
- 亚太地区
- 中国第六国排放气体控制标准
- 印度汽车标准(AIS)
- 日本的燃油效率标准
- 东协汽车法规
- 大型和中型车辆法规
- 拉丁美洲
- 巴西Proconve排放气体标准
- 阿根廷的燃油经济性(CAFE)和安全标准
- 墨西哥NOM标准
- 根据美国墨加协定(USMCA)协调车辆法规
- 中东和非洲
- 阿联酋联邦交通法
- 沙乌地阿拉伯运输和物流法规
- 南非道路交通法
- 东非共同体(EAC)车辆法规
- 北美洲
- 波特五力分析
- PESTEL 分析
- 科技与创新趋势
- 当前技术趋势
- 新兴技术
- 价格趋势
- 按地区
- 副产品
- 生产统计
- 生产基地
- 消费基础
- 进出口
- 成本細項分析
- 车辆购置成本
- 运输和配送成本
- 营运和维护成本
- 监理和合规成本
- 燃料和能源成本
- 专利分析
- 永续性和环境方面
- 永续实践
- 减少废弃物策略
- 生产中的能源效率
- 环保倡议
- 碳足迹考量
- 打入市场策略
- 区域市场渗透策略
- 新参与企业需要考虑的关键监管因素
- 定价、服务和差异化策略
第四章 竞争情势
- 介绍
- 公司市占率分析
- 按地区
- 北美洲
- 欧洲
- 亚太地区
- 拉丁美洲
- 中东和非洲
- 按地区
- 主要企业的竞争分析
- 竞争定位矩阵
- 战略展望矩阵
- 主要趋势
- 企业合併(M&A)
- 伙伴关係与合作
- 新产品发布
- 企业扩张计画和资金筹措
第五章 依驱动因素分類的市场估算与预测(2022-2035 年)
- 内燃机(ICE)
- 电的
- 电池式电动车(BEV)
- 混合动力汽车(HEV)
- 插电式混合动力汽车(PHEV)
第六章 依负载容量的市场估计与预测(2022-2035 年)
- 不足2吨
- 2至3吨
- 超过3吨
第七章 按车辆类型分類的市场估计和预测(2022-2035 年)
- 小型货车(1-2 类)
- 中型厢型车(3级)
- 大型/厢型车(4-6级)
第八章 按轴距和尺寸分類的市场估算和预测(2022-2035 年)
- 紧凑型(轴距小于120吋)
- 标准型(120-140吋)
- 延伸部分(140-160吋)
- 超长(超过 160 吋)
第九章 按商业应用分類的市场估算与预测(2022-2035 年)
- 最后一公里配送
- 宅配/小包裹
- 现场服务
- 其他的
第十章 依销售管道分類的市场估计与预测(2022-2035 年)
- OEM
- 授权经销商网络
第十一章 各地区市场估计与预测(2022-2035 年)
- 北美洲
- 美国
- 加拿大
- 欧洲
- 德国
- 英国
- 法国
- 义大利
- 西班牙
- 俄罗斯
- 北欧国家
- 荷兰
- 瑞典
- 亚太地区
- 中国
- 印度
- 日本
- 澳洲
- 韩国
- 新加坡
- 泰国
- 印尼
- 越南
- 拉丁美洲
- 巴西
- 墨西哥
- 阿根廷
- 中东和非洲
- 南非
- 沙乌地阿拉伯
- 阿拉伯聯合大公国
- 土耳其
第十二章:公司简介
- 世界公司
- Ford
- General Motors
- Hyundai/Kia
- Mercedes-Benz Vans
- Nissan
- Renault Group
- SAIC
- Stellantis
- Toyota
- Volkswagen
- 本地公司
- BYD
- Changan Automobile
- Dongfeng Motor Corporation
- GAC Group
- Isuzu Motors
- Iveco
- 新兴企业/颠覆者
- Arrival
- Greenkraft
- Rivian
- Workhorse Group
The Global Cargo Vans Market was valued at USD 92.7 billion in 2025 and is estimated to grow at a CAGR of 5.1% to reach USD 152.9 billion by 2035.
Market expansion is driven by the steady rise in urban logistics activities and increasing demand for efficient commercial transportation solutions worldwide. The rapid growth of e-commerce platforms, retail distribution networks, and service-based industries is significantly increasing the need for cargo vans to support goods movement across both urban and semi-urban areas. Rising parcel volumes and extended fleet utilization are encouraging logistics providers to invest in reliable and cost-efficient vehicles. At the same time, regulatory pressure to improve fuel efficiency and reduce emissions is influencing fleet replacement cycles, pushing operators toward newer cargo van models with enhanced performance and lower operating expenses. Continuous advancements in vehicle design, drivetrain technologies, and durability are further improving the reliability and operational lifespan of cargo vans. As cities continue to expand and last-mile delivery becomes increasingly critical, cargo vans are emerging as a vital component of modern transportation and distribution ecosystems, supporting sustained market growth across regions.
| Market Scope | |
|---|---|
| Start Year | 2025 |
| Forecast Year | 2026-2035 |
| Start Value | $92.7 Billion |
| Forecast Value | $152.9 Billion |
| CAGR | 5.1% |
The below 2 tons segment accounted for a 57.4% share in 2025 and is expected to grow at a CAGR of 4.7% from 2026 to 2035. Cargo vans within this payload category are widely preferred for last-mile deliveries and service operations due to their maneuverability, efficiency, and adequate load capacity. Their ability to operate efficiently in dense urban settings while meeting daily delivery requirements continues to support strong adoption.
The standard cargo vans with a wheelbase ranging between 120 and 140 inches held a 42% share in 2025. These vehicles are extensively used for regional distribution and multi-stop delivery routes, as they offer an optimal balance between cargo space and ease of navigation. Their configuration supports efficient route planning and maximized fleet utilization for logistics operators.
United States Cargo Vans Market held 88.5% share, generating USD 26.5 billion in 2025. Strong demand is being driven by the rapid expansion of logistics, e-commerce fulfillment, and service-oriented businesses, prompting companies to modernize and expand their commercial vehicle fleets.
Key companies operating in the Global Cargo Vans Market include Ford, Toyota, Volkswagen, Stellantis, Mercedes-Benz Vans, General Motors, Hyundai/Kia, Rivian, SAIC through its Maxus and LDV brands, and the Shyft Group. Companies in the Global Cargo Vans Market are reinforcing their competitive position by focusing on product innovation, efficiency improvements, and portfolio diversification. Manufacturers are investing in advanced powertrain technologies and lightweight vehicle designs to meet evolving regulatory requirements and reduce the total cost of ownership for fleet operators. Strategic partnerships with logistics providers and fleet customers are being leveraged to secure long-term contracts and stable demand. Many players are also expanding manufacturing capabilities and regional footprints to improve supply chain resilience and delivery timelines.
Table of Contents
Chapter 1 Methodology
- 1.1 Market scope and definition
- 1.2 Research design
- 1.2.1 Research approach
- 1.2.2 Data collection methods
- 1.3 Data mining sources
- 1.3.1 Global
- 1.3.2 Regional/Country
- 1.4 Base estimates and calculations
- 1.4.1 Base year calculation
- 1.4.2 Key trends for market estimation
- 1.5 Primary research and validation
- 1.5.1 Primary sources
- 1.6 Forecast model
- 1.7 Research assumptions and limitations
Chapter 2 Executive Summary
- 2.1 Industry 3600 synopsis, 2022 - 2035
- 2.2 Key market trends
- 2.2.1 Regional
- 2.2.2 Propulsion
- 2.2.3 Tonnage Capacity
- 2.2.4 Vehicle Class
- 2.2.5 Wheelbase & Size
- 2.2.6 Commercial End Use
- 2.2.7 Sales Channel
- 2.3 TAM Analysis, 2026-2035
- 2.4 CXO perspectives: Strategic imperatives
- 2.4.1 Executive decision points
- 2.4.2 Critical success factors
- 2.5 Future outlook and strategic recommendations
Chapter 3 Industry Insights
- 3.1 Industry ecosystem analysis
- 3.1.1 Supplier landscape
- 3.1.2 Profit margin analysis
- 3.1.3 Cost structure
- 3.1.4 Value addition at each stage
- 3.1.5 Factor affecting the value chain
- 3.1.6 Disruptions
- 3.2 Industry impact forces
- 3.2.1.1 Growth drivers
- 3.2.1.2 Growth of urban logistics and last mile delivery
- 3.2.1.3 Expansion of e commerce and organized retail
- 3.2.1.4 Fleet renewal and efficiency improvement
- 3.2.1.5 Adoption of alternative powertrains
- 3.2.2 Industry pitfalls and challenges
- 3.2.2.1 High vehicle acquisition costs
- 3.2.2.2 Urban congestion and parking limitations
- 3.2.3 Market opportunities
- 3.2.3.1 Electrification of commercial fleets
- 3.2.3.2 Growth in cold chain and specialized logistics
- 3.2.3.3 Expansion in emerging markets
- 3.3 Growth potential analysis
- 3.4 Regulatory landscape
- 3.4.1 North America
- 3.4.1.1 Federal Motor Carrier Safety Administration (FMCSA) Regulations
- 3.4.1.2 Environmental Protection Agency (EPA) Emission Standards
- 3.4.1.3 California Air Resources Board (CARB) Regulations
- 3.4.2 Europe
- 3.4.2.1 EU Commercial Vehicle Regulations
- 3.4.2.2 Euro 6 Emission Standards
- 3.4.2.3 General Safety Regulation (GSR)
- 3.4.2.4 EU Type Approval Framework
- 3.4.2.5 Digital Tachograph Rules
- 3.4.2.6 Low Emission Zones (LEZ) and Zero Emission Zones (ZEZ)
- 3.4.3 Asia Pacific
- 3.4.3.1 China National VI Emission Standards
- 3.4.3.2 India Automotive Industry Standards (AIS)
- 3.4.3.3 Japan Fuel Economy Standards
- 3.4.3.4 ASEAN Automotive Regulations
- 3.4.3.5 Heavy and Medium Duty Vehicle Regulations
- 3.4.4 Latin America
- 3.4.4.1 Brazil Proconve Emission Standards
- 3.4.4.2 Argentina CAFE and Safety Standards
- 3.4.4.3 Mexico NOM Standards
- 3.4.4.4 USMCA Vehicle Regulatory Alignment
- 3.4.5 Middle East & Africa
- 3.4.5.1 UAE Federal Transport Law
- 3.4.5.2 Saudi Transport and Logistics Regulations
- 3.4.5.3 South African Road Traffic Act
- 3.4.5.4 East African Community (EAC) Vehicle Regulations
- 3.4.1 North America
- 3.5 Porter's analysis
- 3.6 PESTEL analysis
- 3.7 Technology and innovation landscape
- 3.7.1 Current technological trends
- 3.7.2 Emerging technologies
- 3.8 Price trends
- 3.8.1 By region
- 3.8.2 By product
- 3.9 Production statistics
- 3.9.1 Production hubs
- 3.9.2 Consumption hubs
- 3.9.3 Export and import
- 3.10 Cost breakdown analysis
- 3.10.1 Vehicle acquisition costs
- 3.10.2 Transportation and delivery costs
- 3.10.3 Operational and maintenance costs
- 3.10.4 Regulatory and compliance costs
- 3.10.5 Fuel and energy costs
- 3.11 Patent analysis
- 3.12 Sustainability and environmental aspects
- 3.12.1 Sustainable practices
- 3.12.2 Waste reduction strategies
- 3.12.3 Energy efficiency in production
- 3.12.4 Eco-friendly Initiatives
- 3.12.5 Carbon footprint considerations
- 3.13 Go-to-Market strategies
- 3.13.1 Region-specific market penetration strategies
- 3.13.2 Key regulatory considerations for new entrants
- 3.13.3 Pricing, service, and differentiation strategies
Chapter 4 Competitive Landscape, 2025
- 4.1 Introduction
- 4.2 Company market share analysis
- 4.2.1 North America
- 4.2.2 Europe
- 4.2.3 Asia Pacific
- 4.2.4 LATAM
- 4.2.5 MEA
- 4.3 Competitive analysis of major market players
- 4.4 Competitive positioning matrix
- 4.5 Strategic outlook matrix
- 4.6 Key developments
- 4.6.1 Mergers & acquisitions
- 4.6.2 Partnerships & collaborations
- 4.6.3 New Product Launches
- 4.6.4 Expansion Plans and funding
Chapter 5 Market Estimates & Forecast, By Propulsion, 2022 - 2035 ($Bn, Units)
- 5.1 Key trends
- 5.2 ICE
- 5.3 Electric
- 5.3.1 Battery Electric Vehicle (BEV)
- 5.3.2 Hybrid Electric Vehicle (HEV)
- 5.3.3 Plug-in Hybrid Electric Vehicle (PHEV)
Chapter 6 Market Estimates & Forecast, By Tonnage Capacity, 2022 - 2035 ($Bn, Units)
- 6.1 Key trends
- 6.2 Below 2 tons
- 6.3 2 to 3 tons
- 6.4 Above 3 tons
Chapter 7 Market Estimates & Forecast, By Vehicle Class, 2022 - 2035 ($Bn, Units)
- 7.1 Key trends
- 7.2 Light vans (Class 1-2)
- 7.3 Medium vans (Class 3)
- 7.4 Heavy/step vans (Class 4-6)
Chapter 8 Market Estimates & Forecast, By Wheelbase & Size, 2022 - 2035 ($Bn, Units)
- 8.1 Key trends
- 8.2 Compact (wheelbase <120 inches)
- 8.3 Standard (120-140 inches)
- 8.4 Extended (140-160 inches)
- 8.5 Extra-long (>160 inches)
Chapter 9 Market Estimates & Forecast, By Commercial End Use, 2022 - 2035 ($Bn, Units)
- 9.1 Key trends
- 9.2 Last-mile delivery
- 9.3 Courier/parcel
- 9.4 Field services
- 9.5 Others
Chapter 10 Market Estimates & Forecast, By Sales Channel, 2022 - 2035 ($Bn, Units)
- 10.1 Key trends
- 10.2 OEM
- 10.3 Authorized dealership networks
Chapter 11 Market Estimates & Forecast, By Region, 2022 - 2035 ($Bn, Units)
- 11.1 Key trends
- 11.2 North America
- 11.2.1 US
- 11.2.2 Canada
- 11.3 Europe
- 11.3.1 Germany
- 11.3.2 UK
- 11.3.3 France
- 11.3.4 Italy
- 11.3.5 Spain
- 11.3.6 Russia
- 11.3.7 Nordics
- 11.3.8 Netherlands
- 11.3.9 Sweden
- 11.4 Asia Pacific
- 11.4.1 China
- 11.4.2 India
- 11.4.3 Japan
- 11.4.4 Australia
- 11.4.5 South Korea
- 11.4.6 Singapore
- 11.4.7 Thailand
- 11.4.8 Indonesia
- 11.4.9 Vietnam
- 11.5 Latin America
- 11.5.1 Brazil
- 11.5.2 Mexico
- 11.5.3 Argentina
- 11.6 MEA
- 11.6.1 South Africa
- 11.6.2 Saudi Arabia
- 11.6.3 UAE
- 11.6.4 Turkey
Chapter 12 Company Profiles
- 12.1 Global Players
- 12.1.1 Ford
- 12.1.2 General Motors
- 12.1.3 Hyundai/Kia
- 12.1.4 Mercedes-Benz Vans
- 12.1.5 Nissan
- 12.1.6 Renault Group
- 12.1.7 SAIC
- 12.1.8 Stellantis
- 12.1.9 Toyota
- 12.1.10 Volkswagen
- 12.2 Regional Players
- 12.2.1 BYD
- 12.2.2 Changan Automobile
- 12.2.3 Dongfeng Motor Corporation
- 12.2.4 GAC Group
- 12.2.5 Isuzu Motors
- 12.2.6 Iveco
- 12.3 Emerging Players / Disruptors
- 12.3.1 Arrival
- 12.3.2 Greenkraft
- 12.3.3 Rivian
- 12.3.4 Workhorse Group
 汽车行李箱市场按类型、材料、容量、应用、最终用户和分销管道划分,全球预测(2026-2032年)全球运输胶带市场:按产品类型、胶带宽度、黏合剂类型、厚度、应用和最终用户划分-2026-2032年全球预测超限货物运输市场(按车辆类型、服务类型、运输方式、货物类型和最终用户产业划分),全球预测(2026-2032年)
 船对船转运服务市场按服务类型、操作类型、安装地点、最终用户行业和地区划分
 宠物订阅盒市场预测至2032年:按产品、宠物类型、目标年龄、主题和地区分類的全球分析
 全球货车市场
 2025年全球超大货物运输市场报告全球货箱市场
 货轮的全球市场的评估:船舶类别,各燃料类型,各最终用途,各地区,机会,预测(2018年~2032年)2025年全球电动垃圾车市场报告