


 |
市场调查报告书
商品编码
1666986
LNG 终端市场机会、成长动力、产业趋势分析及 2025 - 2034 年预测LNG Terminal Market Opportunity, Growth Drivers, Industry Trend Analysis, and Forecast 2025 - 2034 |
||||||
2024 年全球液化天然气终端市场价值为 79 亿美元,预计 2025 年至 2034 年期间将以 13.9% 的强劲复合年增长率增长。天然气因其高效性和较低的环境影响而成为人们首选的能源替代品。它燃烧更清洁,同时释放更少的温室气体和污染物,这与全球对永续能源解决方案的日益关注相一致。 LNG基础设施的技术进步也推动了市场成长,提高了营运效率并降低了专案成本。低温储存和液化製程的进步等关键创新提高了液化天然气项目的经济可行性,确保了市场采用率的稳定上升。
在追求成本效益和技术先进的解决方案的推动下,陆上液化天然气终端产业的规模预计到 2034 年将超过 300 亿美元。增强的液化方法、现代化的储存系统和简化的再气化流程正在改变营运格局。小型本地化终端的开发正在满足工业和远端应用的特定能源需求,以支援更广泛的能源可近性。这些进步正在加速陆上终端在向低碳能源系统转变中的作用,确保可靠和可持续的能源供应。
| 市场范围 | |
|---|---|
| 起始年份 | 2024 |
| 预测年份 | 2025-2034 |
| 起始值 | 79亿美元 |
| 预测值 | 320亿美元 |
| 复合年增长率 | 13.9% |
同时,浮式液化天然气终端市场由于其灵活性和成本效益而正在经历巨大的发展势头。浮动码头设计用于在海上作业,具有移动性,无需大量的陆上基础设施。这些码头受益于技术进步,安全性和营运效率不断提高。增强的液化能力、更低的能源使用量以及减少甲烷排放的创新正在推动它们的吸引力,确保在不断发展的能源市场中站稳脚跟。
在美国,液化天然气终端市场规模预计到 2034 年将超过 170 亿美元。配备最先进的液化和储存系统的升级设施正在提高效率的同时降低营运成本。此外,该产业专注于采用环保技术和减排策略,从而形成更永续的能源框架。这些进步,加上能源消耗的增加和向环保解决方案的转变,使美国成为全球液化天然气领域的关键参与者。
目录
第 1 章:方法论与范围
- 市场定义
- 基础估算与计算
- 预测计算
- 资料来源
- 基本的
- 次要
- 有薪资的
- 民众
第 2 章:执行摘要
第 3 章:产业洞察
- 产业生态系统分析
- 监管格局
- 产业衝击力
- 成长动力
- 产业陷阱与挑战
- 成长潜力分析
- 波特的分析
- 供应商的议价能力
- 买家的议价能力
- 新进入者的威胁
- 替代品的威胁
- PESTEL 分析
第四章:竞争格局
- 介绍
- 战略仪表板
- 创新与永续发展格局
第五章:市场规模及预测:依终端,2021 – 2034 年
- 主要趋势
- 陆上
- 漂浮的
第六章:市场规模及预测:按地区,2021 – 2034 年
- 主要趋势
- 北美洲
- 我们
- 加拿大
- 墨西哥
- 欧洲
- 英国
- 法国
- 荷兰
- 西班牙
- 波兰
- 俄罗斯
- 义大利
- 亚太地区
- 中国
- 印度
- 日本
- 韩国
- 澳洲
- 泰国
- 马来西亚
- 印尼
- 中东和非洲
- 阿联酋
- 卡达
- 阿曼
- 阿尔及利亚
- 埃及
- 拉丁美洲
- 巴西
- 阿根廷
第七章:公司简介
- ADNOC
- AES
- BP
- Chevron
- CNPC
- Engas
- Engie
- Eni
- Equinor
- ExxonMobil
- Gazprom
- KNPC
- Pertamina
- Petronas
- Petronet
- Qatar Energy
- Repsol
- Shell
- Total
- Vopak
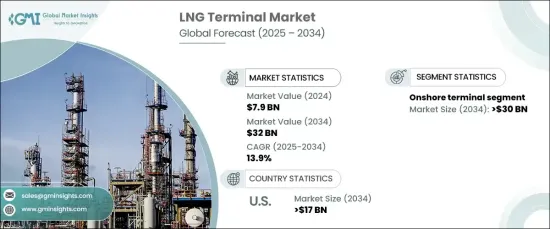
The Global LNG Terminal Market, valued at USD 7.9 billion in 2024, is projected to grow at a robust CAGR of 13.9% from 2025 to 2034. The shift towards cleaner energy sources and the global decline in coal and oil usage has significantly boosted the consumption of natural gas. Recognized for its efficiency and lower environmental impact, natural gas has become a preferred energy alternative. Its ability to burn more cleanly while releasing fewer greenhouse gases and pollutants aligns with the increasing global focus on sustainable energy solutions. Technological advancements in LNG infrastructure are also propelling market growth, making operations more efficient and reducing project costs. Key innovations, such as advancements in cryogenic storage and liquefaction processes, have enhanced the economic feasibility of LNG projects, ensuring a steady rise in market adoption.
The onshore LNG terminal sector is expected to exceed USD 30 billion by 2034, driven by the pursuit of cost-efficient and technologically advanced solutions. Enhanced liquefaction methods, modernized storage systems, and streamlined regasification processes are transforming the operational landscape. The development of smaller, localized terminals is meeting the specific energy demands of industrial and remote applications, supporting broader energy accessibility. These advancements are accelerating the role of onshore terminals in the shift towards low-carbon energy systems, ensuring reliable and sustainable energy supplies.
| Market Scope | |
|---|---|
| Start Year | 2024 |
| Forecast Year | 2025-2034 |
| Start Value | $7.9 Billion |
| Forecast Value | $32 Billion |
| CAGR | 13.9% |
Simultaneously, the floating LNG terminal market is experiencing substantial momentum due to its flexibility and cost-effectiveness. Floating terminals designed to operate in offshore locations, offer mobility and eliminate the need for extensive onshore infrastructure. These terminals are benefiting from technological progress, improving safety and operational efficiency. Enhanced liquefaction capabilities, lower energy usage, and innovations to mitigate methane emissions are driving their appeal, ensuring a stronger foothold in the evolving energy market.
In the United States, the LNG terminal market is anticipated to surpass USD 17 billion by 2034. Growing demand for cleaner energy at both domestic and international levels is fueling investments in advanced terminal infrastructure. Upgraded facilities with state-of-the-art liquefaction and storage systems are enhancing efficiency while reducing operational costs. Additionally, the industry's focus on adopting eco-friendly technologies and strategies for emissions reduction is shaping a more sustainable energy framework. These advancements, coupled with increasing energy consumption and a transition towards environmentally conscious solutions, are positioning the United States as a key player in the global LNG landscape.
Table of Contents
Chapter 1 Methodology & Scope
- 1.1 Market definitions
- 1.2 Base estimates & calculations
- 1.3 Forecast calculation
- 1.4 Data sources
- 1.4.1 Primary
- 1.4.2 Secondary
- 1.4.2.1 Paid
- 1.4.2.2 Public
Chapter 2 Executive Summary
- 2.1 Industry synopsis, 2021 - 2034
Chapter 3 Industry Insights
- 3.1 Industry ecosystem analysis
- 3.2 Regulatory landscape
- 3.3 Industry impact forces
- 3.3.1 Growth drivers
- 3.3.2 Industry pitfalls & challenges
- 3.4 Growth potential analysis
- 3.5 Porter's analysis
- 3.5.1 Bargaining power of suppliers
- 3.5.2 Bargaining power of buyers
- 3.5.3 Threat of new entrants
- 3.5.4 Threat of substitutes
- 3.6 PESTEL analysis
Chapter 4 Competitive Landscape, 2024
- 4.1 Introduction
- 4.2 Strategic dashboard
- 4.3 Innovation & sustainability landscape
Chapter 5 Market Size and Forecast, By Terminal, 2021 – 2034 (MTPA, USD Million)
- 5.1 Key trends
- 5.2 Onshore
- 5.3 Floating
Chapter 6 Market Size and Forecast, By Region, 2021 – 2034 (MTPA, USD Million)
- 6.1 Key trends
- 6.2 North America
- 6.2.1 U.S.
- 6.2.2 Canada
- 6.2.3 Mexico
- 6.3 Europe
- 6.3.1 UK
- 6.3.2 France
- 6.3.3 Netherlands
- 6.3.4 Spain
- 6.3.5 Poland
- 6.3.6 Russia
- 6.3.7 Italy
- 6.4 Asia Pacific
- 6.4.1 China
- 6.4.2 India
- 6.4.3 Japan
- 6.4.4 South Korea
- 6.4.5 Australia
- 6.4.6 Thailand
- 6.4.7 Malaysia
- 6.4.8 Indonesia
- 6.5 Middle East & Africa
- 6.5.1 UAE
- 6.5.2 Qatar
- 6.5.3 Oman
- 6.5.4 Algeria
- 6.5.5 Egypt
- 6.6 Latin America
- 6.6.1 Brazil
- 6.6.2 Argentina
Chapter 7 Company Profiles
- 7.1 ADNOC
- 7.2 AES
- 7.3 BP
- 7.4 Chevron
- 7.5 CNPC
- 7.6 Engas
- 7.7 Engie
- 7.8 Eni
- 7.9 Equinor
- 7.10 ExxonMobil
- 7.11 Gazprom
- 7.12 KNPC
- 7.13 Pertamina
- 7.14 Petronas
- 7.15 Petronet
- 7.16 Qatar Energy
- 7.17 Repsol
- 7.18 Shell
- 7.19 Total
- 7.20 Vopak
 2026年全球液化天然气(LNG)虚拟管道市场报告
 LNG接收站市场-全球产业规模、份额、趋势、机会、预测:按类型、位置、应用、地区和竞争格局划分,2021-2031年
 液化天然气(LNG)基础设施市场规模、份额和成长分析(按类型、应用、所有权和地区划分)-2026-2033年产业预测大型液化天然气接收站市场-全球产业规模、份额、趋势、机会及预测(依技术、地点、应用、地区及竞争格局划分,2020-2030年预测)
 大型液化LNG接收站市场(按服务、设施类型、所有者和应用)—2025-2032 年全球预测小型LNG接收站市场(按类型、供应类型和应用)—2025-2032 年全球预测全球LNG接收站市场(按终端类型、技术、储存容量、位置和最终用途)预测 2025-2030
 全球大型液化LNG接收站市场
 全球LNG接收站市场(按终端类型、容量、技术、功能和地区划分)- 2030 年预测
 LNG接收站市场分析及预测(至 2033 年):按类型、产品、服务、技术、组件、应用、最终用户、安装类型、设备