


 |
市场调查报告书
商品编码
1666999
提高石油采收率的市场机会、成长动力、产业趋势分析和 2025 - 2034 年预测Enhanced Oil Recovery Market Opportunity, Growth Drivers, Industry Trend Analysis, and Forecast 2025 - 2034 |
||||||
2024 年全球提高石油采收率市场价值为 391 亿美元,预计 2025 年至 2034 年期间年复合增长率为 7.5%。这些因素很大程度上归因于全球工业成长和城市人口的增加。此外,持续的技术进步和持续的勘探活动在增强 EOR 技术方面发挥关键作用,进一步促进了该行业的发展。全球能源消耗的成长,特别是受人口成长和城市化推动,以及石油和天然气生产需求的增加,预计将继续支持市场扩张。
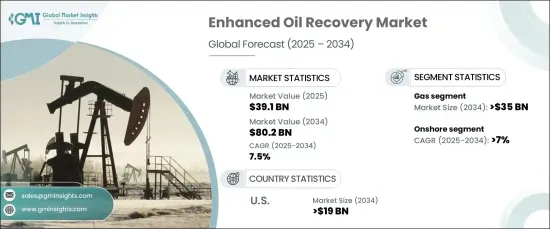
此外,将表面活性剂或聚合物与注水相结合的混合系统的开发有望降低成本并显着影响该行业。预计减少环境影响的微生物 EOR 方法的引入也将有助于增加市场需求。这些创新有助于提高石油开采过程的效率和环境永续性。随着这些进步,受不断增长的能源需求以及对更永续、更具成本效益的能源解决方案的需求的推动,预计到 2034 年天然气产业的规模将超过 350 亿美元。
| 市场范围 | |
|---|---|
| 起始年份 | 2024 |
| 预测年份 | 2025-2034 |
| 起始值 | 391亿美元 |
| 预测值 | 802亿美元 |
| 复合年增长率 | 7.5% |
预计到 2034 年,陆上 EOR 领域的年复合成长率(CAGR) 将超过 7%,这得益于陆上油田感测器和资料分析平台等先进技术的整合。这些技术可以实现更好的管理和更有效率的资源开采。
由于新的碳氢化合物发现和政府支持的推广 EOR 技术的倡议,美国提高石油采收率市场规模预计到 2034 年将超过 190 亿美元。人工智慧、自动化和感测器技术的引入进一步提高了石油采收率并优化了生产力,为未来几年市场实现显着成长奠定了基础。
随着石油勘探和生产的不断扩大,以及有利的监管框架的支持,EOR市场将持续实现积极成长。
目录
第 1 章:方法论与范围
- 市场定义
- 基础估算与计算
- 预测计算
- 资料来源
- 基本的
- 次要
- 有薪资的
- 民众
第 2 章:执行摘要
第 3 章:产业洞察
- 产业生态系统分析
- 监管格局
- 产业衝击力
- 成长动力
- 产业陷阱与挑战
- 成长潜力分析
- 波特的分析
- 供应商的议价能力
- 买家的议价能力
- 新进入者的威胁
- 替代品的威胁
- PESTEL 分析
第四章:竞争格局
- 介绍
- 战略仪表板
- 创新与永续发展格局
第 5 章:市场规模与预测:依技术,2021 – 2034 年
- 主要趋势
- 气体
- 二氧化碳
- 氮
- 其他的
- 热的
- 蒸气
- 原位燃烧
- 热水
- 化学
- 聚合物
- 碱性
- 界面活性剂
- 其他的
第 6 章:市场规模与预测:按应用,2021 – 2034 年
- 主要趋势
- 陆上
- 海上
第 7 章:市场规模及预测:按地区,2021 – 2034 年
- 主要趋势
- 北美洲
- 我们
- 加拿大
- 墨西哥
- 欧洲
- 德国
- 俄罗斯
- 英国
- 挪威
- 荷兰
- 亚太地区
- 中国
- 印度
- 印尼
- 马来西亚
- 中东和非洲
- 沙乌地阿拉伯
- 阿联酋
- 阿曼
- 土耳其
- 奈及利亚
- 埃及
- 拉丁美洲
- 巴西
第八章:公司简介
- ADNOC
- Baker Hughes
- BP
- Cenovus
- Chevron
- CNPC
- ConocoPhillips
- ExxonMobil
- Halliburton
- Kinder Morgan
- Linde
- Lukoil
- Occidental
- SLB
- Titan Oil Recovery
- TotalEnergies
The Global Enhanced Oil Recovery Market was valued at USD 39.1 billion in 2024 and is expected to grow at a CAGR of 7.5% annually from 2025 to 2034. This market growth is driven by several factors, including the decreasing output from existing fields, the increasing number of mature wells, and the surging demand for crude oil and petroleum products. These factors are largely due to industrial growth and the rising urban population worldwide. Additionally, ongoing technological advancements and continued exploration activities are playing a key role in enhancing EOR techniques, further boosting the industry. The rise in global energy consumption, particularly driven by population growth and urbanization, alongside increasing oil and gas production requirements, is expected to continue supporting market expansion.
Furthermore, the development of hybrid systems, which combine surfactants or polymers with water flooding, is expected to reduce costs and significantly influence the industry. The introduction of microbial EOR methods, which reduce environmental impact, is also expected to contribute to increased market demand. These innovations are helping improve the efficiency and environmental sustainability of oil extraction processes. In line with these advancements, the gas sector is projected to surpass USD 35 billion by 2034, fueled by growing energy demand and the need for more sustainable and cost-effective energy solutions.
| Market Scope | |
|---|---|
| Start Year | 2024 |
| Forecast Year | 2025-2034 |
| Start Value | $39.1 Billion |
| Forecast Value | $80.2 Billion |
| CAGR | 7.5% |
The onshore EOR segment is anticipated to witness a compound annual growth rate (CAGR) of over 7% through 2034, driven by the integration of advanced technologies such as sensors and data analytics platforms in onshore oil fields. These technologies enable better management and more efficient resource extraction.
The U.S. enhanced oil recovery market is expected to exceed USD 19 billion by 2034, bolstered by new hydrocarbon discoveries and government-backed initiatives to promote EOR techniques. The introduction of artificial intelligence, automation, and sensor technologies further enhances oil recovery and optimizes production rates, positioning the market for significant growth in the coming years.
With continuous expansion in oil exploration and production, supported by favorable regulatory frameworks, the EOR market is set to experience ongoing positive growth.
Table of Contents
Chapter 1 Methodology & Scope
- 1.1 Market definitions
- 1.2 Base estimates & calculations
- 1.3 Forecast calculation
- 1.4 Data sources
- 1.4.1 Primary
- 1.4.2 Secondary
- 1.4.2.1 Paid
- 1.4.2.2 Public
Chapter 2 Executive Summary
- 2.1 Industry synopsis, 2021 - 2034
Chapter 3 Industry Insights
- 3.1 Industry ecosystem analysis
- 3.2 Regulatory landscape
- 3.3 Industry impact forces
- 3.3.1 Growth drivers
- 3.3.2 Industry pitfalls & challenges
- 3.4 Growth potential analysis
- 3.5 Porter's analysis
- 3.5.1 Bargaining power of suppliers
- 3.5.2 Bargaining power of buyers
- 3.5.3 Threat of new entrants
- 3.5.4 Threat of substitutes
- 3.6 PESTEL analysis
Chapter 4 Competitive Landscape, 2024
- 4.1 Introduction
- 4.2 Strategic dashboard
- 4.3 Innovation & sustainability landscape
Chapter 5 Market Size and Forecast, By Technology, 2021 – 2034 (USD Million, Billion Barrels)
- 5.1 Key trends
- 5.2 Gas
- 5.2.1 CO2
- 5.2.2 Nitrogen
- 5.2.3 Others
- 5.3 Thermal
- 5.3.1 Steam
- 5.3.2 In-situ combustion
- 5.3.3 Hot water
- 5.4 Chemical
- 5.4.1 Polymer
- 5.4.2 Alkaline
- 5.4.3 Surfactant
- 5.5 Others
Chapter 6 Market Size and Forecast, By Application, 2021 – 2034 (USD Million, Billion Barrels)
- 6.1 Key trends
- 6.2 Onshore
- 6.3 Offshore
Chapter 7 Market Size and Forecast, By Region, 2021 – 2034 (USD Million, Billion Barrels)
- 7.1 Key trends
- 7.2 North America
- 7.2.1 U.S
- 7.2.2 Canada
- 7.2.3 Mexico
- 7.3 Europe
- 7.3.1 Germany
- 7.3.2 Russia
- 7.3.3 UK
- 7.3.4 Norway
- 7.3.5 Netherlands
- 7.4 Asia Pacific
- 7.4.1 China
- 7.4.2 India
- 7.4.3 Indonesia
- 7.4.4 Malaysia
- 7.5 Middle East & Africa
- 7.5.1 Saudi Arabia
- 7.5.2 UAE
- 7.5.3 Oman
- 7.5.4 Türkiye
- 7.5.5 Nigeria
- 7.5.6 Egypt
- 7.6 Latin America
- 7.6.1 Brazil
Chapter 8 Company Profiles
- 8.1 ADNOC
- 8.2 Baker Hughes
- 8.3 BP
- 8.4 Cenovus
- 8.5 Chevron
- 8.6 CNPC
- 8.7 ConocoPhillips
- 8.8 ExxonMobil
- 8.9 Halliburton
- 8.10 Kinder Morgan
- 8.11 Linde
- 8.12 Lukoil
- 8.13 Occidental
- 8.14 SLB
- 8.15 Titan Oil Recovery
- 8.16 TotalEnergies
 按技术、应用和地区提高采收率市场
 化学提高采收率市场(依产品类型、油藏类型、最终用户和通路划分)-2025-2032年全球预测按方法、储存类型、采收机制、应用和部署类型提高采收率市场-2025-2032 年全球预测
 全球微生物提高采收率市场
 美国的提高石油采收率用奈米粒子市场:类型·注射法·各地区的机会及预测 (2018-2032年)
 2025年提高采收率全球市场报告
 强化采油市场(依技术、应用、最终用户、国家及地区)-2025 年至 2032 年全球产业分析、市场规模、市场占有率及预测奈米颗粒在强化采油市场的评估:按类型、注入方法和地区划分的机会与预测(2018-2032 年)
 化学的提高石油采收率 (EOR) 市场:2025-2035年
 提高采收率市场规模、份额及成长分析(依技术、应用及地区)-2025-2032 年产业预测