


 |
市场调查报告书
商品编码
1667158
触觉技术市场机会、成长动力、产业趋势分析与 2025 - 2034 年预测Haptic Technology Market Opportunity, Growth Drivers, Industry Trend Analysis, and Forecast 2025 - 2034 |
||||||
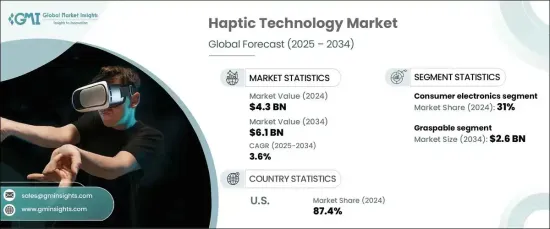
2024 年全球触觉技术市场规模达到 43 亿美元,预计 2025 年至 2034 年期间复合年增长率为 3.6%。这一市场成长受到多种因素的推动,包括对虚拟实境(VR)和扩增实境(AR)中更身临其境的体验的需求不断增长,其中先进的触觉系统正在增强真实感和用户参与度。随着这些技术变得越来越主流,使用者正在寻求更深层、更逼真的交互,而触觉回馈是提供这种体验的重要元素。
此外,触觉技术与消费性电子产品的整合大大提升了其市场占有率。智慧型手机、穿戴式装置、游戏装置和触控介面都受益于触觉回馈,为用户提供增强的互动和参与度。人们对更流畅、更直观的介面的需求正在不断扩大,触觉回馈在连接数位世界和物理世界方面发挥关键作用。随着各行各业越来越认识到触觉系统的价值,行动应用、游戏和虚拟实境中的应用正成为创造更具互动性和沈浸感的数位体验的核心。
| 市场范围 | |
|---|---|
| 起始年份 | 2024 |
| 预测年份 | 2025-2034 |
| 起始值 | 43亿美元 |
| 预测值 | 61亿美元 |
| 复合年增长率 | 3.6% |
触觉技术市场多种多样,主要应用涵盖消费性电子、游戏、汽车、医疗保健、机器人和其他领域。 2024 年,消费性电子产品领域将占据领先地位,占据 31% 的市场。触觉技术现已成为智慧型手机、平板电脑和智慧手錶等设备的基本组成部分。透过为虚拟键盘、通知和触摸手势提供触觉响应,它以以前不可能的方式增强了用户体验和参与度,为用户提供与其设备的触觉连接。
此外,触觉系统根据使用类型分类,包括可抓握、可触摸和可穿戴系统。到 2034 年,可抓握设备市场预计将创造 26 亿美元的收入。它们在游戏、机器人和工业模拟等行业尤其有价值,因为创造逼真的使用者体验至关重要。
美国在全球触觉技术市场占据主导地位,2024 年的市占率高达 87.4%。随着 VR 和 AR 技术不断受到欢迎,触觉回馈系统在一系列应用中的整合预计将扩大,进一步巩固美国作为这些创新技术领先市场的地位。
目录
第 1 章:方法论与范围
- 市场范围和定义
- 基础估算与计算
- 预测计算
- 资料来源
- 基本的
- 次要
- 付费来源
- 公共资源
第 2 章:执行摘要
第 3 章:产业洞察
- 产业生态系统分析
- 影响价值链的因素
- 利润率分析
- 中断
- 未来展望
- 製造商
- 经销商
- 供应商概况
- 利润率分析
- 重要新闻及倡议
- 监管格局
- 衝击力
- 成长动力
- VR 和 AR 技术的进步
- 触觉技术在消费性电子产品的应用日益广泛
- 扩大在医疗保健和医疗器材领域的应用
- 穿戴式装置需求不断成长
- 产业陷阱与挑战
- 先进触觉设备成本高昂
- 技术限制和标准化挑战
- 成长动力
- 成长潜力分析
- 波特的分析
- PESTEL 分析
第四章:竞争格局
- 介绍
- 公司市占率分析
- 竞争定位矩阵
- 战略展望矩阵
第 5 章:市场估计与预测:按组件,2021 年至 2034 年
- 主要趋势
- 硬体
- 软体
第 6 章:市场估计与预测:按回馈,2021 年至 2034 年
- 主要趋势
- 力量
- 触
- 振动触觉
- 电触觉
- 超音波触觉
- 热的
第 7 章:市场估计与预测:按使用类型,2021 年至 2034 年
- 主要趋势
- 可抓握
- 可触摸
- 穿戴
第 8 章:市场估计与预测:按应用,2021 年至 2034 年
- 主要趋势
- 消费性电子产品
- 赌博
- 汽车
- 卫生保健
- 机器人
- 其他的
第 9 章:市场估计与预测:按地区,2021 年至 2034 年
- 主要趋势
- 北美洲
- 我们
- 加拿大
- 欧洲
- 英国
- 德国
- 法国
- 义大利
- 西班牙
- 俄罗斯
- 亚太地区
- 中国
- 印度
- 日本
- 韩国
- 澳洲
- 拉丁美洲
- 巴西
- 墨西哥
- 中东及非洲
- 南非
- 沙乌地阿拉伯
- 阿联酋
第十章:公司简介
- AAC Technologies
- Aito BV
- Force Dimension
- Geomagic, Inc.
- Immersion Corporation
- Imagis Co., Ltd.
- Johnson Electric Holdings Limited
- Microchip Technology Incorporated
- Nidec Corporation
- Onsemi
- Precision Microdrives Limited
- Senseg Oy
- Synaptics Incorporated
- TDK Corporation
- Texas Instruments Incorporated
- Ultraleap Limited
The Global Haptic Technology Market reached USD 4.3 billion in 2024 and is forecasted to expand at a CAGR of 3.6% from 2025 to 2034. Haptic technology, which provides tactile feedback in response to user interactions, has become a game-changer across multiple industries. This market growth is being driven by several factors, including the increasing demand for more immersive experiences in virtual reality (VR) and augmented reality (AR), where advanced haptic systems are enhancing realism and user engagement. As these technologies become more mainstream, users are seeking deeper, more lifelike interactions, making haptic feedback an essential element for delivering that experience.
Moreover, the integration of haptic technology into consumer electronics has significantly boosted its market presence. Smartphones, wearables, gaming devices, and touch interfaces are all benefiting from tactile feedback, offering users enhanced interaction and engagement. The demand for smoother, more intuitive interfaces is expanding, with haptic feedback playing a key role in bridging the digital and physical worlds. As industries increasingly recognize the value of haptic systems, applications in mobile apps, gaming, and VR are becoming central to creating more interactive and immersive digital experiences.
| Market Scope | |
|---|---|
| Start Year | 2024 |
| Forecast Year | 2025-2034 |
| Start Value | $4.3 Billion |
| Forecast Value | $6.1 Billion |
| CAGR | 3.6% |
The haptic technology market is diverse, with key applications spanning consumer electronics, gaming, automotive, healthcare, robotics, and other sectors. In 2024, the consumer electronics segment led the charge, holding a 31% share of the market. Haptic technology is now a fundamental part of devices like smartphones, tablets, and smartwatches. By providing tactile responses to virtual keyboards, notifications, and touch gestures, it enhances user experience and engagement in ways that were previously not possible, offering users a tactile sense of connection with their devices.
Additionally, haptic systems are categorized by usage type, which includes graspable, touchable, and wearable systems. The graspable segment is set to generate USD 2.6 billion in revenue by 2034. These devices, typically used in handheld controllers or objects, deliver tactile sensations that replicate physical feedback, such as texture, resistance, or motion. They are particularly valuable in industries like gaming, robotics, and industrial simulations, where creating a lifelike user experience is paramount.
The U.S. dominates the global haptic technology market, holding an impressive 87.4% market share in 2024. The country's leadership is driven by its strong presence in the consumer electronics and gaming sectors, alongside significant investments in developing cutting-edge haptic solutions. As VR and AR technologies continue to rise in popularity, the integration of haptic feedback systems across a range of applications is expected to expand, further solidifying the U.S.'s position as the leading market for these innovative technologies.
Table of Contents
Chapter 1 Methodology & Scope
- 1.1 Market scope & definitions
- 1.2 Base estimates & calculations
- 1.3 Forecast calculations
- 1.4 Data sources
- 1.4.1 Primary
- 1.4.2 Secondary
- 1.4.2.1 Paid sources
- 1.4.2.2 Public sources
Chapter 2 Executive Summary
- 2.1 Industry synopsis, 2021-2034
Chapter 3 Industry Insights
- 3.1 Industry ecosystem analysis
- 3.1.1 Factor affecting the value chain
- 3.1.2 Profit margin analysis
- 3.1.3 Disruptions
- 3.1.4 Future outlook
- 3.1.5 Manufacturers
- 3.1.6 Distributors
- 3.2 Supplier landscape
- 3.3 Profit margin analysis
- 3.4 Key news & initiatives
- 3.5 Regulatory landscape
- 3.6 Impact forces
- 3.6.1 Growth drivers
- 3.6.1.1 Advancements in VR and AR technologies
- 3.6.1.2 Increasing adoption of haptic technology in consumer electronics
- 3.6.1.3 Expanding use in healthcare and medical devices
- 3.6.1.4 Growing demand for wearable devices
- 3.6.2 Industry pitfalls & challenges
- 3.6.2.1 High cost of advanced haptic devices
- 3.6.2.2 Technical limitations and standardization challenges
- 3.6.1 Growth drivers
- 3.7 Growth potential analysis
- 3.8 Porter’s analysis
- 3.9 PESTEL analysis
Chapter 4 Competitive Landscape, 2024
- 4.1 Introduction
- 4.2 Company market share analysis
- 4.3 Competitive positioning matrix
- 4.4 Strategic outlook matrix
Chapter 5 Market Estimates & Forecast, By Component, 2021-2034 (USD Million)
- 5.1 Key trends
- 5.2 Hardware
- 5.3 Software
Chapter 6 Market Estimates & Forecast, By Feedback, 2021-2034 (USD Million)
- 6.1 Key trends
- 6.2 Force
- 6.3 Tactile
- 6.3.1 Vibrotactile
- 6.3.2 Electro tactile
- 6.3.3 Ultrasonic Tactile
- 6.4 Thermal
Chapter 7 Market Estimates & Forecast, By Usage Type, 2021-2034 (USD Million)
- 7.1 Key trends
- 7.2 Graspable
- 7.3 Touchable
- 7.4 Wearable
Chapter 8 Market Estimates & Forecast, By Application, 2021-2034 (USD Million)
- 8.1 Key trends
- 8.2 Consumer electronics
- 8.3 Gaming
- 8.4 Automotive
- 8.5 Healthcare
- 8.6 Robotics
- 8.7 Others
Chapter 9 Market Estimates & Forecast, By Region, 2021-2034 (USD Million)
- 9.1 Key trends
- 9.2 North America
- 9.2.1 U.S.
- 9.2.2 Canada
- 9.3 Europe
- 9.3.1 UK
- 9.3.2 Germany
- 9.3.3 France
- 9.3.4 Italy
- 9.3.5 Spain
- 9.3.6 Russia
- 9.4 Asia Pacific
- 9.4.1 China
- 9.4.2 India
- 9.4.3 Japan
- 9.4.4 South Korea
- 9.4.5 Australia
- 9.5 Latin America
- 9.5.1 Brazil
- 9.5.2 Mexico
- 9.6 MEA
- 9.6.1 South Africa
- 9.6.2 Saudi Arabia
- 9.6.3 UAE
Chapter 10 Company Profiles
- 10.1 AAC Technologies
- 10.2 Aito BV
- 10.3 Force Dimension
- 10.4 Geomagic, Inc.
- 10.5 Immersion Corporation
- 10.6 Imagis Co., Ltd.
- 10.7 Johnson Electric Holdings Limited
- 10.8 Microchip Technology Incorporated
- 10.9 Nidec Corporation
- 10.10 Onsemi
- 10.11 Precision Microdrives Limited
- 10.12 Senseg Oy
- 10.13 Synaptics Incorporated
- 10.14 TDK Corporation
- 10.15 Texas Instruments Incorporated
- 10.16 Ultraleap Limited
 全球触觉技术市场:市场规模、份额、趋势分析(按回馈类型、致动器技术、组件、应用和地区划分)、展望和预测(2025-2032 年)
 2025年全球触觉设备市场报告
 触觉回馈手术环境市场(按设备类型、应用、回馈方式、组件和最终用户划分)—2025-2032年全球预测2025年触觉技术全球市场报告
 全球触觉技术市场(按回馈类型、组件、产业垂直和地区划分)- 预测至 2030 年2025年表面触觉技术全球市场报告触觉技术市场(按组件、技术类型、连接性、应用和最终用户划分)—2025 年至 2030 年全球预测
 2025 年至 2033 年触觉技术市场报告(按组件、回馈、技术、应用和地区)
 汽车神经自适应触觉回馈组件市场 - 全球及区域分析:按车辆类型、按推进类型、按自主程度、按组件、按产品类型、按国家/地区 - 分析与预测(2025 年至 2035 年)
 行动触觉技术市场按类型、产品和地区划分