


 |
市场调查报告书
商品编码
1667189
高光谱成像系统市场机会、成长动力、产业趋势分析与 2025 - 2034 年预测Hyperspectral Imaging Systems Market Opportunity, Growth Drivers, Industry Trend Analysis, and Forecast 2025 - 2034 |
||||||
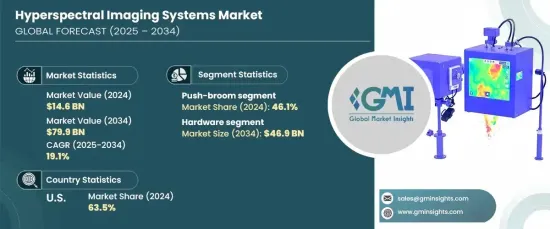
2024 年全球高光谱成像系统市场价值为 146 亿美元,预计 2025 年至 2034 年期间的复合年增长率为 19.1%。这些创新促进了紧凑型高光谱相机和轻型感测器的发展,它们可以整合到无人机、无人驾驶飞行器(UAV)和便携式设备中,使该技术更加容易获得。高光谱成像越来越多地用于遥感和实地调查,并扩大其在地质、林业和灾害管理等领域的影响力。此外,采用简介高光谱相机和推扫式扫描器等先进的扫描技术简化了操作,使系统更易于小型行业使用。这些技术突破为各领域的高光谱成像打开了新的大门。
食品和饮料等需要精确品质控制的行业对高光谱成像系统的需求特别高。这些系统正成为检测污染物、确保食品安全和监测产品品质的重要工具。高光谱成像可以有效识别食品中的外来物、腐败和不一致之处,支持更严格的食品安全法规和消费者对高品质产品日益增长的需求。
| 市场范围 | |
|---|---|
| 起始年份 | 2024 |
| 预测年份 | 2025-2034 |
| 起始值 | 146亿美元 |
| 预测值 | 799亿美元 |
| 复合年增长率 | 19.1% |
根据技术,市场可分为推扫式、简介式和扫扫式高光谱成像。推扫式高光谱成像领域在 2024 年占据最大份额,占 46.1% 的市场。推扫技术因其较高的空间和光谱分辨率而受到广泛青睐,可以捕获详细的光谱资料,特别是在农业、环境监测和国防监视等应用领域。然而,虽然该技术提供了出色的性能,但它需要在扫描过程中进行精确的运动控制和对准,这使得部署更加复杂和更昂贵。
高光谱成像系统市场也分为硬体和软体部分。预计到 2034 年硬体部分将创收 469资料美元。随着感测器技术和小型化的进步,对紧凑型和便携式高光谱成像解决方案的需求激增。这些改进使得在无人机、无人驾驶飞机和手持设备中部署高光谱成像系统成为可能,从而扩大了其在农业、国防和医疗保健等领域的用途。
2024 年,美国将占据北美市场的 63.5% 的主导份额,这得益于国防、航太和医疗保健领域的大量投资。美国国防部利用高光谱成像进行军事监视、目标侦测和边境安全。此外,医疗保健产业也受益于这些系统进行非侵入性诊断、疾病检测和手术指导。精准农业和食品安全领域高光谱成像的日益普及,以及研究机构和政府措施的大力支持也推动了美国市场的成长。
目录
第 1 章:方法论与范围
- 市场范围和定义
- 基础估算与计算
- 预测计算
- 资料来源
- 基本的
- 次要
- 付费来源
- 公共资源
第 2 章:执行摘要
第 3 章:产业洞察
- 产业生态系统分析
- 影响价值链的因素
- 利润率分析
- 中断
- 未来展望
- 製造商
- 经销商
- 供应商概况
- 利润率分析
- 重要新闻及倡议
- 监管格局
- 衝击力
- 成长动力
- 感测器和小型化的技术进步
- 食品和饮料品质控制需求增加
- 在农业和环境监测的应用
- 国防和监视应用的需求不断增长
- 产业陷阱与挑战
- 实施成本高且复杂
- 缺乏标准化资料处理和熟练的劳动力
- 成长动力
- 成长潜力分析
- 波特的分析
- PESTEL 分析
第四章:竞争格局
- 介绍
- 公司市占率分析
- 竞争定位矩阵
- 战略展望矩阵
第 5 章:市场估计与预测:按组件,2021 年至 2034 年
- 主要趋势
- 硬体
- 相机
- 感应器
- 镜头
- 侦测器
- 软体
- 影像处理软体
- 数据分析软体:
- 视觉化软体
- 校准软体
- 光谱分析软体
- 机器学习和人工智慧软体
第 6 章:市场估计与预测:按技术,2021 年至 2034 年
- 主要趋势
- 推扫式高光谱成像
- 简介高光谱成像
- Whiskbroom 高光谱成像
- 其他的
第 7 章:市场估计与预测:按光谱范围,2021 年至 2034 年
- 主要趋势
- 可见光/近红外线 (VNIR)
- 短波红外线 (SWIR)
- 长波红外线 (LWIR)
第 8 章:市场估计与预测:按应用,2021 年至 2034 年
- 主要趋势
- 农业
- 医疗诊断
- 环境监测
- 食品和饮料
- 工业检测
- 其他的
第 9 章:市场估计与预测:按地区,2021 年至 2034 年
- 主要趋势
- 北美洲
- 我们
- 加拿大
- 欧洲
- 英国
- 德国
- 法国
- 义大利
- 西班牙
- 俄罗斯
- 亚太地区
- 中国
- 印度
- 日本
- 韩国
- 澳洲
- 拉丁美洲
- 巴西
- 墨西哥
- 中东及非洲
- 南非
- 沙乌地阿拉伯
- 阿联酋
第十章:公司简介
- Applied Spectral Imaging
- BaySpec, Inc.
- ClydeHSI
- Corning Incorporated
- Cubert GmbH
- Diaspective Vision
- Gamaya
- Headwall Photonics, Inc.
- Hinalea Imaging Corp.
- HyperMed Imaging, Inc.
- imec
- Malvern Panalytical Ltd
- Norsk Elektro Optikk AS
- Orbital Sidekick
- Photon Etc
- Resonon
- Specim, Spectral Imaging Ltd.
- Surface Optics Corporation
- Telops Inc.
- XIMEA GmbH
The Global Hyperspectral Imaging Systems Market was valued at USD 14.6 billion in 2024 and is expected to expand at a CAGR of 19.1% from 2025 to 2034. The market growth is driven by continuous advancements in hyperspectral imaging technology, such as sensor miniaturization, enhanced spectral resolution, and cost-effective solutions. These innovations have led to the development of compact hyperspectral cameras and lightweight sensors that can be integrated into drones, unmanned aerial vehicles (UAVs), and portable devices, making the technology more accessible. Hyperspectral imaging is increasingly used for remote sensing and field surveys, expanding its presence in sectors like geology, forestry, and disaster management. Additionally, the adoption of advanced scanning technologies like snapshot hyperspectral cameras and push-broom scanners has simplified operations and made the systems easier to use for smaller industries. These technological breakthroughs are opening new doors for hyperspectral imaging in various fields.
The demand for hyperspectral imaging systems is particularly high in industries that require precise quality control, such as food and beverages. These systems are becoming vital tools for detecting contaminants, ensuring food safety, and monitoring product quality. Hyperspectral imaging can effectively identify foreign materials, spoilage, and inconsistencies in food items, supporting stricter food safety regulations and the growing consumer demand for high-quality products.
| Market Scope | |
|---|---|
| Start Year | 2024 |
| Forecast Year | 2025-2034 |
| Start Value | $14.6 billion |
| Forecast Value | $79.9 billion |
| CAGR | 19.1% |
The market can be categorized by technology into push-broom, snapshot, and whiskbroom hyperspectral imaging. The push-broom hyperspectral imaging segment was the largest in 2024, accounting for 46.1% of the market. Push-broom technology is widely favored due to its high spatial and spectral resolution, allowing for detailed spectral data capture, especially in applications like agriculture, environmental monitoring, and defense surveillance. However, while this technology provides excellent performance, its need for precise motion control and alignment during scanning makes deployment more complex and costly.
The hyperspectral imaging systems market is also divided into hardware and software components. The hardware segment is expected to generate USD 46.9 billion by 2034. This segment includes key components such as hyperspectral sensors, cameras, light sources, and data acquisition systems. With advancements in sensor technology and miniaturization, the demand for compact and portable hyperspectral imaging solutions has surged. These improvements make it possible to deploy hyperspectral imaging systems in drone, UAV, and handheld formats, expanding their use in fields like agriculture, defense, and healthcare.
In 2024, the U.S. held the dominant share of the North American market at 63.5%, driven by substantial investments in defense, aerospace, and healthcare. The U.S. Department of Defense utilizes hyperspectral imaging for military surveillance, target detection, and border security. Additionally, the healthcare industry benefits from these systems for non-invasive diagnostics, disease detection, and surgical guidance. The U.S. market's growth is also supported by the increasing adoption of hyperspectral imaging in precision agriculture and food safety, along with a strong presence of research institutions and government initiatives.
Table of Contents
Chapter 1 Methodology & Scope
- 1.1 Market scope & definitions
- 1.2 Base estimates & calculations
- 1.3 Forecast calculations
- 1.4 Data sources
- 1.4.1 Primary
- 1.4.2 Secondary
- 1.4.2.1 Paid sources
- 1.4.2.2 Public sources
Chapter 2 Executive Summary
- 2.1 Industry synopsis, 2021-2034
Chapter 3 Industry Insights
- 3.1 Industry ecosystem analysis
- 3.1.1 Factor affecting the value chain
- 3.1.2 Profit margin analysis
- 3.1.3 Disruptions
- 3.1.4 Future outlook
- 3.1.5 Manufacturers
- 3.1.6 Distributors
- 3.2 Supplier landscape
- 3.3 Profit margin analysis
- 3.4 Key news & initiatives
- 3.5 Regulatory landscape
- 3.6 Impact forces
- 3.6.1 Growth drivers
- 3.6.1.1 Technological advancements in sensors and miniaturization
- 3.6.1.2 Increased demand in food and beverage quality control
- 3.6.1.3 Adoption in agriculture and environmental monitoring
- 3.6.1.4 Rising demand in defense and surveillance applications
- 3.6.2 Industry pitfalls & challenges
- 3.6.2.1 High implementation costs and complexity
- 3.6.2.2 Lack of standardized data processing and skilled workforce
- 3.6.1 Growth drivers
- 3.7 Growth potential analysis
- 3.8 Porter’s analysis
- 3.9 PESTEL analysis
Chapter 4 Competitive Landscape, 2024
- 4.1 Introduction
- 4.2 Company market share analysis
- 4.3 Competitive positioning matrix
- 4.4 Strategic outlook matrix
Chapter 5 Market Estimates & Forecast, By Component, 2021-2034 (USD Billion)
- 5.1 Key trends
- 5.2 Hardware
- 5.2.1 Cameras
- 5.2.2 Sensors
- 5.2.3 Lenses
- 5.2.4 Detectors
- 5.3 Software
- 5.3.1 Image processing software
- 5.3.2 Data analysis software:
- 5.3.3 Visualization software
- 5.3.4 Calibration software
- 5.3.5 Spectral analysis software
- 5.3.6 Machine learning and AI software
Chapter 6 Market Estimates & Forecast, By Technology, 2021-2034 (USD Billion)
- 6.1 Key trends
- 6.2 Push-broom hyperspectral imaging
- 6.3 Snapshot hyperspectral imaging
- 6.4 Whiskbroom hyperspectral imaging
- 6.5 Others
Chapter 7 Market Estimates & Forecast, By Spectrum Range, 2021-2034 (USD Billion)
- 7.1 Key trends
- 7.2 Visible/Near-Infrared (VNIR)
- 7.3 Shortwave Infrared (SWIR)
- 7.4 Longwave Infrared (LWIR)
Chapter 8 Market Estimates & Forecast, By Application, 2021-2034 (USD Billion)
- 8.1 Key trends
- 8.2 Agriculture
- 8.3 Medical diagnostics
- 8.4 Environmental monitoring
- 8.5 Food and beverages
- 8.6 Industrial inspection
- 8.7 Others
Chapter 9 Market Estimates & Forecast, By Region, 2021-2034 (USD Billion)
- 9.1 Key trends
- 9.2 North America
- 9.2.1 U.S.
- 9.2.2 Canada
- 9.3 Europe
- 9.3.1 UK
- 9.3.2 Germany
- 9.3.3 France
- 9.3.4 Italy
- 9.3.5 Spain
- 9.3.6 Russia
- 9.4 Asia Pacific
- 9.4.1 China
- 9.4.2 India
- 9.4.3 Japan
- 9.4.4 South Korea
- 9.4.5 Australia
- 9.5 Latin America
- 9.5.1 Brazil
- 9.5.2 Mexico
- 9.6 MEA
- 9.6.1 South Africa
- 9.6.2 Saudi Arabia
- 9.6.3 UAE
Chapter 10 Company Profiles
- 10.1 Applied Spectral Imaging
- 10.2 BaySpec, Inc.
- 10.3 ClydeHSI
- 10.4 Corning Incorporated
- 10.5 Cubert GmbH
- 10.6 Diaspective Vision
- 10.7 Gamaya
- 10.8 Headwall Photonics, Inc.
- 10.9 Hinalea Imaging Corp.
- 10.10 HyperMed Imaging, Inc.
- 10.11 imec
- 10.12 Malvern Panalytical Ltd
- 10.13 Norsk Elektro Optikk AS
- 10.14 Orbital Sidekick
- 10.15 Photon Etc
- 10.16 Resonon
- 10.17 Specim, Spectral Imaging Ltd.
- 10.18 Surface Optics Corporation
- 10.19 Telops Inc.
- 10.20 XIMEA GmbH
 高光谱成像系统市场:依产品、技术和应用划分 - 全球预测至 2036 年
 2026年全球超音波乳化设备市场报告
 高光谱影像市场,全球市场 2026-2030 年
 高光谱影像:市场占有率分析、产业趋势与统计、成长预测(2026-2031)
 全球医用高光谱成像市场:市场规模、占有率、成长率、产业分析、依类型、应用和地区划分的分析以及未来预测(2026-2034)
 高光谱和多光谱成像市场(2025):技术、应用和市场趋势
 机载高光谱遥测成像相机:全球市占率及排名、总收入及需求预测(2025-2031年)高光谱影像(HSI)在农业科学中的应用:全球市场份额和排名、总收入和需求预测(2025-2031 年)
 农业高光谱影像:按应用、平台、最终用户和感测器划分-2025-2032年全球预测高光谱遥测影像系统市场按产品类型、技术、频谱范围和应用划分-2025-2032年全球预测