


 |
市场调查报告书
商品编码
1684661
光谱感测器市场机会、成长动力、产业趋势分析及 2025 - 2034 年预测Spectral Sensor Market Opportunity, Growth Drivers, Industry Trend Analysis, and Forecast 2025 - 2034 |
||||||
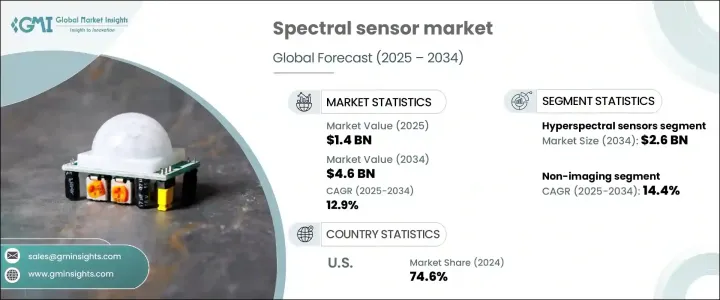
2024 年全球光谱感测器市场价值为 14 亿美元,预计将大幅成长,预计 2025 年至 2034 年的复合年增长率为 12.9%。光谱感测器处于这一转变的最前沿,使农民能够深入了解作物健康、土壤条件和营养水平。
透过提供即时资料,光谱感测器有助于优化肥料、水利用和病虫害防治等投入,最终提高作物产量并实现更有效率的资源管理。随着全球农业转向更多技术驱动的实践,光谱感测器的采用预计将上升,从而支持数位化农业的更广泛趋势。除了农业之外,市场还受到环境监测、医疗保健和汽车等行业日益增长的兴趣,精准的数据驱动洞察力对于这些行业至关重要。
| 市场范围 | |
|---|---|
| 起始年份 | 2024 |
| 预测年份 | 2025-2034 |
| 起始值 | 14亿美元 |
| 预测值 | 46亿美元 |
| 复合年增长率 | 12.9% |
市场分为两种主要的感测器类型:多光谱感测器和高光谱感测器。高光谱感测器市场规模预计到 2034 年达到 26 亿美元,这得益于其捕获高度详细的光谱资料的能力。高光谱感测器提供更高分辨率的信息,使其成为需要精确材料检测或环境分析的行业必不可少的。然而,更常用的是多光谱感测器,它可以在有限范围的光谱带(通常在三到十个之间)内捕获资料。这些感测器在农业、环境监测和遥感领域特别受欢迎,因为它们能够以更实惠的成本检测植被健康状况、土壤状况和水质并提供可操作的见解。它们的简单性和有效性使其成为不需要高光谱感测器的高解析度功能的行业的理想选择。
从技术方面来看,光谱感测器市场进一步细分为成像感测器和非成像感测器。非影像感测器领域正在快速成长,预计 2025 年至 2034 年之间的复合年增长率为 14.4%。另一方面,成像光谱感测器用于需要高解析度资料的应用,例如精准农业和详细的环境评估。这些感测器可以捕获空间和光谱信息,从而对场景进行彻底的分析。它们与无人机和卫星的结合可进行大规模资料收集,成为市场成长的主要驱动力。
2024 年,美国光谱感测器市场占有 74.6% 的份额。这种主导地位的推动因素包括技术的快速进步、精准农业的大量投资以及环境监测和医疗保健领域的日益普及。美国是光谱感测器市场主要参与者的所在地,其强大的研发能力推动了持续创新。政府致力于推广永续农业实践和先进农业技术的倡议进一步加速了光谱感测器在各个行业的应用。此外,光谱感测器在汽车和消费性电子产品领域的应用日益广泛,为市场扩张提供了进一步的动力。
目录
第 1 章:方法论与范围
- 市场范围和定义
- 基础估算与计算
- 预测计算
- 资料来源
- 基本的
- 次要
- 付费来源
- 公共资源
第 2 章:执行摘要
第 3 章:产业洞察
- 产业生态系统分析
- 影响价值链的因素
- 利润率分析
- 中断
- 未来展望
- 製造商
- 经销商
- 供应商概况
- 利润率分析
- 重要新闻及倡议
- 监管格局
- 衝击力
- 成长动力
- 精准农业需求不断成长
- 扩大环境监测应用
- 消费性电子产品的进步
- 汽车业采用率不断提高
- 增加对生物医学应用的投资
- 产业陷阱与挑战
- 资料处理与管理挑战
- 初始成本高且整合复杂
- 成长动力
- 成长潜力分析
- 波特的分析
- PESTEL 分析
第四章:竞争格局
- 介绍
- 公司市占率分析
- 竞争定位矩阵
- 战略展望矩阵
第 5 章:市场估计与预测:按产品类型,2021-2034 年
- 主要趋势
- 多光谱感测器
- 高光谱感测器
第 6 章:市场估计与预测:按技术,2021 年至 2034 年
- 主要趋势
- 影像学
- 非影像
第 7 章:市场估计与预测:按应用,2021 年至 2034 年
- 主要趋势
- 农业
- 环境监测
- 卫生保健
- 食品和饮料
- 航太和国防
- 其他的
第 8 章:市场估计与预测:按地区,2021 年至 2034 年
- 主要趋势
- 北美洲
- 我们
- 加拿大
- 欧洲
- 英国
- 德国
- 法国
- 义大利
- 西班牙
- 俄罗斯
- 亚太地区
- 中国
- 印度
- 日本
- 韩国
- 澳洲
- 拉丁美洲
- 巴西
- 墨西哥
- 中东及非洲
- 南非
- 沙乌地阿拉伯
- 阿联酋
第九章:公司简介
- Axiom Semiconductor
- BAE Systems
- BaySpec, Inc.
- Corning Incorporated
- FLIR Systems
- Hamamatsu Photonics KK
- Hyperspectral Imaging Systems LLC
- L3Harris Technologies
- Lockheed Martin
- Middleton Spectral Vision
- Pepperl+Fuchs, Inc.
- Raytheon Technologies
- Sensors Unlimited (UTC)
- SRI International
- Teledyne Technologies
The Global Spectral Sensor Market, valued at USD 1.4 billion in 2024, is on track to experience substantial growth, with a projected CAGR of 12.9% from 2025 to 2034. This growth is being fueled by the rising demand for more precise agricultural solutions as the world faces the challenges of increasing food demand and the growing emphasis on sustainable farming. Spectral sensors are at the forefront of this transformation, enabling farmers to gain valuable insights into crop health, soil conditions, and nutrient levels.
By providing real-time data, spectral sensors help optimize inputs like fertilizers, water usage, and pest control, ultimately leading to better crop yields and more efficient resource management. As global agriculture shifts toward more technology-driven practices, the adoption of spectral sensors is expected to rise, supporting the broader trend of digital farming. Beyond agriculture, the market is also experiencing increased interest from industries such as environmental monitoring, healthcare, and automotive, where precise, data-driven insights are critical.
| Market Scope | |
|---|---|
| Start Year | 2024 |
| Forecast Year | 2025-2034 |
| Start Value | $1.4 Billion |
| Forecast Value | $4.6 Billion |
| CAGR | 12.9% |
The market is divided into two primary sensor types: multispectral and hyperspectral sensors. The hyperspectral sensor segment is poised to reach USD 2.6 billion by 2034, driven by its ability to capture highly detailed spectral data. Hyperspectral sensors provide a higher resolution of information, making them essential in industries that require precise material detection or environmental analysis. However, multispectral sensors, which capture data across a limited range of spectral bands (usually between three to ten), are more commonly used. These sensors are particularly favored in agriculture, environmental monitoring, and remote sensing for their ability to detect vegetation health, soil conditions, and water quality with actionable insights at a more affordable cost. Their simplicity and effectiveness make them an attractive option for industries that don't require the high-resolution capabilities of hyperspectral sensors.
In terms of technology, the spectral sensor market is further segmented into imaging and non-imaging sensors. The non-imaging sensor segment is growing at a rapid pace, with a projected CAGR of 14.4% between 2025 and 2034. Non-imaging sensors are often simpler and more cost-effective, making them ideal for widespread use in applications like agriculture and environmental monitoring. On the other hand, imaging spectral sensors are used in applications requiring high-resolution data, such as precision agriculture and detailed environmental assessments. These sensors can capture both spatial and spectral information, providing a thorough analysis of a scene. Their integration with drones and satellites for large-scale data collection has been a key driver of market growth.
In 2024, the U.S. spectral sensor market held a commanding 74.6% share. This dominance is driven by rapid technological advancements, significant investments in precision agriculture, and growing adoption in environmental monitoring and healthcare sectors. The U.S. is home to major players in the spectral sensor market, bolstered by strong research and development capabilities that foster continuous innovation. Government initiatives aimed at promoting sustainable agricultural practices and advanced farming techniques are further accelerating the use of spectral sensors across industries. Additionally, the growing application of spectral sensors in automotive and consumer electronics is providing further impetus to market expansion.
Table of Contents
Chapter 1 Methodology & Scope
- 1.1 Market scope & definitions
- 1.2 Base estimates & calculations
- 1.3 Forecast calculations
- 1.4 Data sources
- 1.4.1 Primary
- 1.4.2 Secondary
- 1.4.2.1 Paid sources
- 1.4.2.2 Public sources
Chapter 2 Executive Summary
- 2.1 Industry synopsis, 2021-2034
Chapter 3 Industry Insights
- 3.1 Industry ecosystem analysis
- 3.1.1 Factor affecting the value chain
- 3.1.2 Profit margin analysis
- 3.1.3 Disruptions
- 3.1.4 Future outlook
- 3.1.5 Manufacturers
- 3.1.6 Distributors
- 3.2 Supplier landscape
- 3.3 Profit margin analysis
- 3.4 Key news & initiatives
- 3.5 Regulatory landscape
- 3.6 Impact forces
- 3.6.1 Growth drivers
- 3.6.1.1 Increasing demand for precision agriculture
- 3.6.1.2 Expanding applications in environmental monitoring
- 3.6.1.3 Advancements in consumer electronics
- 3.6.1.4 Rising adoption in the automotive industry
- 3.6.1.5 Increasing investments in biomedical applications
- 3.6.2 Industry pitfalls & challenges
- 3.6.2.1 Data processing and management challenges
- 3.6.2.2 High initial costs and complex integration
- 3.6.1 Growth drivers
- 3.7 Growth potential analysis
- 3.8 Porter's analysis
- 3.9 PESTEL analysis
Chapter 4 Competitive Landscape, 2024
- 4.1 Introduction
- 4.2 Company market share analysis
- 4.3 Competitive positioning matrix
- 4.4 Strategic outlook matrix
Chapter 5 Market Estimates & Forecast, By Product Type, 2021-2034 (USD Billion) (Million Units)
- 5.1 Key trends
- 5.2 Multispectral sensors
- 5.3 Hyperspectral sensors
Chapter 6 Market Estimates & Forecast, By Technology, 2021-2034 (USD Billion) (Million Units)
- 6.1 Key trends
- 6.2 Imaging
- 6.3 Non-imaging
Chapter 7 Market Estimates & Forecast, By Application, 2021-2034 (USD Billion) (Million Units)
- 7.1 Key trends
- 7.2 Agriculture
- 7.3 Environmental monitoring
- 7.4 Healthcare
- 7.5 Food & beverage
- 7.6 Aerospace & defense
- 7.7 Others
Chapter 8 Market Estimates & Forecast, By Region, 2021-2034 (USD Billion) (Million Units)
- 8.1 Key trends
- 8.2 North America
- 8.2.1 U.S.
- 8.2.2 Canada
- 8.3 Europe
- 8.3.1 UK
- 8.3.2 Germany
- 8.3.3 France
- 8.3.4 Italy
- 8.3.5 Spain
- 8.3.6 Russia
- 8.4 Asia Pacific
- 8.4.1 China
- 8.4.2 India
- 8.4.3 Japan
- 8.4.4 South Korea
- 8.4.5 Australia
- 8.5 Latin America
- 8.5.1 Brazil
- 8.5.2 Mexico
- 8.6 MEA
- 8.6.1 South Africa
- 8.6.2 Saudi Arabia
- 8.6.3 UAE
Chapter 9 Company Profiles
- 9.1 Axiom Semiconductor
- 9.2 BAE Systems
- 9.3 BaySpec, Inc.
- 9.4 Corning Incorporated
- 9.5 FLIR Systems
- 9.6 Hamamatsu Photonics K.K.
- 9.7 Hyperspectral Imaging Systems LLC
- 9.8 L3Harris Technologies
- 9.9 Lockheed Martin
- 9.10 Middleton Spectral Vision
- 9.11 Pepperl+Fuchs, Inc.
- 9.12 Raytheon Technologies
- 9.13 Sensors Unlimited (UTC)
- 9.14 SRI International
- 9.15 Teledyne Technologies
 2025年酒精感测器全球市场报告
 电子倍增管市场报告:趋势、预测和竞争分析(至 2031 年)重力感测器市场报告:趋势、预测和竞争分析(至 2031 年)
 赛车运动用感测器的全球市场 (~2032年):感测器类型·类型·赛车类型·销售管道·各地区
 色彩对比感测器市场规模、份额和成长分析(按技术、垂直和地区)- 产业预测 2025-2032
 电梯地震感测器市场-2025年至2030年的预测2030 年波前感测器市场预测:按类型、波长、应用、最终用户和地区进行全球分析自由落体感测器市场:现状分析与未来预测 (2024年~2032年)
 毫米波感测器和模组的全球市场规模、份额和趋势分析:按频宽、应用和区域分類的展望和预测(2024-2031)
 2025-2033 年日本感测器市场报告(按参数测量、操作模式、最终用途产业和地区)