


 |
市场调查报告书
商品编码
1684775
智慧城市市场机会、成长动力、产业趋势分析与 2024 - 2032 年预测Smart Cities Market Opportunity, Growth Drivers, Industry Trend Analysis, and Forecast 2024 - 2032 |
||||||
2024 年全球智慧城市市场价值将达到 6,340 亿美元,预计 2025 年至 2034 年期间将以 15.8% 的强劲复合年增长率扩张。这一增长的动力来自于解决快速城市化和人口增长带来的挑战的迫切需求。随着城市继续以前所未有的速度发展,城市基础设施面临巨大压力,这反过来又刺激了对创新解决方案的需求。智慧城市利用物联网 (IoT)、人工智慧 (AI) 和巨量资料分析等尖端技术来改善城市规划、简化公共服务并创造更永续、更有效率的环境。借助这些技术,智慧城市旨在更好地利用资源、降低成本、提高市民生活品质并推动经济成长。
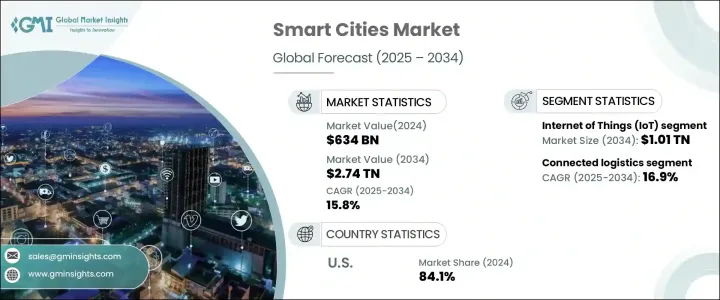
智慧城市市场由几项关键技术主导,包括物联网、巨量资料分析、云端运算和人工智慧。其中,物联网领域预计将占据领先地位,到 2034 年市场价值预计将达到 1.01 兆美元。物联网透过连接各种设备、感测器和系统发挥关键作用,从而实现即时资料的收集。这种整合有利于做出更明智的决策、提高营运效率并优化公共服务交付。物联网在智慧城市的应用涵盖交通管理、能源监控、废弃物管理和公共安全等多个领域,成为改善整体城市功能的关键驱动力。
| 市场范围 | |
|---|---|
| 起始年份 | 2023 |
| 预测年份 | 2024-2032 |
| 起始值 | 6340亿美元 |
| 预测值 | 2.74兆美元 |
| 复合年增长率 | 15.8% |
市场中的智慧移动领域也正在经历快速成长,重点关注城市移动解决方案、交通监控和管理以及停车管理和互联物流。预计互联物流产业将实现最快的成长,2025 年至 2034 年期间的复合年增长率为 16.9%。物联网、GPS 和人工智慧等技术透过提供即时追踪、路线优化和改进的供应链管理来改变物流,使运输更有效率并减少对环境的影响。
2024 年,美国智慧城市市场占据 84.1% 的主导份额,反映出其在该领域的持续领导地位。这一增长得益于政府的大量投资以及物联网、人工智慧和巨量资料分析的技术进步。美国继续引领智慧城市计划,特别是透过联邦政府的资金和政策来推动智慧解决方案的采用。这些解决方案有助于优化交通、能源管理和安全等公共服务。然而,实施成本高和网路安全问题等挑战仍然存在。儘管存在这些障碍,但强大的基础设施投资、有利的监管框架以及对智慧城市技术发展的明确承诺仍然支撑着市场。
目录
第 1 章:方法论与范围
- 市场范围和定义
- 基础估算与计算
- 预测计算
- 资料来源
- 基本的
- 次要
- 付费来源
- 公共资源
第 2 章:执行摘要
第 3 章:产业洞察
- 产业生态系统分析
- 影响价值链的因素
- 利润率分析
- 中断
- 未来展望
- 製造商
- 经销商
- 供应商概况
- 利润率分析
- 重要新闻及倡议
- 监管格局
- 衝击力
- 成长动力
- 都市化进程加速,人口成长
- 政府对智慧城市计画的措施和资金
- 物联网和连接技术的进步
- 更加重视永续性和能源效率
- 资料隐私和安全问题
- 产业陷阱与挑战
- 对改善公共安全和保障的需求日益增长
- 实施成本高且资金有限
- 成长动力
- 成长潜力分析
- 波特的分析
- PESTEL 分析
第四章:竞争格局
- 介绍
- 公司市占率分析
- 竞争定位矩阵
- 战略展望矩阵
第 5 章:市场估计与预测:按技术,2021 年至 2034 年
- 主要趋势
- 城市交通解决方案
- 交通监控与管理
- 停车管理
- 互联物流
- 其他的
第六章:市场估计与预测:依智慧出行,2021-2034 年
- 主要趋势
- 钢
- 铜和铜合金
- 塑胶
- 其他(复合材料等)
第 7 章:市场估计与预测:按智慧医疗,2021 年至 2034 年
- 主要趋势
- 远距医疗
- 远距医疗
- 智慧医院
- 其他的
第 8 章:市场估计与预测:按智慧建筑,2021 年至 2034 年
- 主要趋势
- 建筑能源管理系统 (BEMS)
- 智慧家庭
- 智慧电网
- 安全与安保管理
- 其他的
第 9 章:市场估计与预测:按智慧公用事业,2021 年至 2034 年
- 主要趋势
- 能源和水资源管理
- 废弃物管理
- 仪表资料管理
- 配送管理系统
- 其他的
第 10 章:市场估计与预测:按智慧治理,2021 年至 2034 年
- 主要趋势
- 都市监控
- 电子化政府
- 智慧照明
- 智慧基础设施
第 11 章:市场估计与预测:按地区,2021 年至 2034 年
- 主要趋势
- 北美洲
- 我们
- 加拿大
- 欧洲
- 英国
- 德国
- 法国
- 义大利
- 西班牙
- 俄罗斯
- 亚太地区
- 中国
- 印度
- 日本
- 韩国
- 澳洲
- 拉丁美洲
- 巴西
- 墨西哥
- 中东及非洲
- 南非
- 沙乌地阿拉伯
- 阿联酋
第 12 章:公司简介
- ABB Ltd.
- AT&T Inc.
- AVEVA Group plc.
- Cisco Systems, Inc.
- Ericsson
- Fujitsu Limited
- General Electric
- Hitachi, Ltd.
- Honeywell International Inc.
- Huawei Technologies Co., Ltd.
- IBM
- Intel Corporation
- Itron Inc.
- Microsoft Corporation
- NEC Corporation
- Nokia
- Oracle Corporation
- Schneider Electric SE
- Siemens AG
- Telefónica SA
- Verizon
The Global Smart Cities Market, valued at USD 634 billion in 2024, is projected to expand at a robust CAGR of 15.8% from 2025 to 2034. This growth is driven by the pressing need to address the challenges posed by rapid urbanization and population growth. As cities continue to grow at an unprecedented rate, urban infrastructure is under immense strain, which in turn fuels the demand for innovative solutions. Smart cities leverage cutting-edge technologies like the Internet of Things (IoT), artificial intelligence (AI), and big data analytics to improve urban planning, streamline public services, and create more sustainable, efficient environments. With the help of these technologies, smart cities aim to make better use of resources, reduce costs, enhance the quality of life for citizens, and drive economic growth.
The smart cities market is dominated by several key technologies, including IoT, big data analytics, cloud computing, and AI. Among these, the IoT segment is expected to lead, with a projected market value of USD 1.01 trillion by 2034. IoT plays a critical role by connecting various devices, sensors, and systems, enabling the collection of real-time data. This integration fosters smarter decision-making, greater operational efficiency, and optimized public service delivery. Applications of IoT in smart cities span multiple sectors, such as traffic management, energy monitoring, waste management, and public safety, making it a key driver in improving overall urban functionality.
| Market Scope | |
|---|---|
| Start Year | 2023 |
| Forecast Year | 2024-2032 |
| Start Value | $634 Billion |
| Forecast Value | $2.74 Trillion |
| CAGR | 15.8% |
The smart mobility segment within the market is also experiencing rapid growth, with a strong focus on urban mobility solutions, traffic surveillance, and management, as well as parking management and connected logistics. The connected logistics sector is anticipated to see the fastest growth, expanding at a CAGR of 16.9% between 2025 and 2034. Technologies like IoT, GPS, and AI are transforming logistics by offering real-time tracking, route optimization, and improved supply chain management, making transportation more efficient and reducing environmental impact.
The US smart cities market accounted for a dominant share of 84.1% in 2024, reflecting its ongoing leadership in this space. This growth is propelled by substantial government investments and technological advancements in IoT, AI, and big data analytics. The US continues to spearhead smart city initiatives, particularly through federal funding and policies that promote the adoption of smart solutions. These solutions are helping to optimize public services, such as transportation, energy management, and safety. However, challenges like high implementation costs and cybersecurity concerns remain. Despite these obstacles, the market is supported by strong infrastructure investments, favorable regulatory frameworks, and a clear commitment to the development of smart city technologies.
Table of Contents
Chapter 1 Methodology & Scope
- 1.1 Market scope & definitions
- 1.2 Base estimates & calculations
- 1.3 Forecast calculations
- 1.4 Data sources
- 1.4.1 Primary
- 1.4.2 Secondary
- 1.4.2.1 Paid sources
- 1.4.2.2 Public sources
Chapter 2 Executive Summary
- 2.1 Industry synopsis, 2021-2034
Chapter 3 Industry Insights
- 3.1 Industry ecosystem analysis
- 3.1.1 Factor affecting the value chain
- 3.1.2 Profit margin analysis
- 3.1.3 Disruptions
- 3.1.4 Future outlook
- 3.1.5 Manufacturers
- 3.1.6 Distributors
- 3.2 Supplier landscape
- 3.3 Profit margin analysis
- 3.4 Key news & initiatives
- 3.5 Regulatory landscape
- 3.6 Impact forces
- 3.6.1 Growth drivers
- 3.6.1.1 Rising urbanization and population growth
- 3.6.1.2 Government initiatives and funding for smart city projects
- 3.6.1.3 Advancements in IoT and connectivity technologies
- 3.6.1.4 Increasing focus on sustainability and energy efficiency
- 3.6.1.5 Data privacy and security concerns
- 3.6.2 Industry pitfalls & challenges
- 3.6.2.1 Growing demand for improved public safety and security
- 3.6.2.2 High implementation costs and limited funding
- 3.6.1 Growth drivers
- 3.7 Growth potential analysis
- 3.8 Porter’s analysis
- 3.9 PESTEL analysis
Chapter 4 Competitive Landscape, 2024
- 4.1 Introduction
- 4.2 Company market share analysis
- 4.3 Competitive positioning matrix
- 4.4 Strategic outlook matrix
Chapter 5 Market Estimates & Forecast, By Technology, 2021-2034 (USD Billion)
- 5.1 Key trends
- 5.2 Urban mobility solutions
- 5.3 Traffic surveillance & management
- 5.4 Parking management
- 5.5 Connected logistics
- 5.6 Others
Chapter 6 Market Estimates & Forecast, By Smart Mobility, 2021-2034 (USD Billion)
- 6.1 Key trends
- 6.2 Steel
- 6.3 Copper and copper alloys
- 6.4 Plastic
- 6.5 Others (Composite Material, etc.)
Chapter 7 Market Estimates & Forecast, By Smart Healthcare, 2021-2034 (USD Billion)
- 7.1 Key trends
- 7.2 Telemedicine
- 7.3 Remote healthcare
- 7.4 Smart hospitals
- 7.5 Others
Chapter 8 Market Estimates & Forecast, By Smart Building, 2021-2034 (USD Billion)
- 8.1 Key trends
- 8.2 Building Energy Management Systems (BEMS)
- 8.3 Smart homes
- 8.4 Smart grid
- 8.5 Safety & security management
- 8.6 Others
Chapter 9 Market Estimates & Forecast, By Smart Utilities, 2021-2034 (USD Billion)
- 9.1 Key trends
- 9.2 Energy & water management
- 9.3 Waste management
- 9.4 Meter data management
- 9.5 Distribution management system
- 9.6 Others
Chapter 10 Market Estimates & Forecast, By Smart Governance, 2021-2034 (USD Billion)
- 10.1 Key trends
- 10.2 City surveillance
- 10.3 E-governance
- 10.4 Smart lighting
- 10.5 Smart infrastructure
Chapter 11 Market Estimates & Forecast, By Region, 2021-2034 (USD Billion)
- 11.1 Key trends
- 11.2 North America
- 11.2.1 U.S.
- 11.2.2 Canada
- 11.3 Europe
- 11.3.1 UK
- 11.3.2 Germany
- 11.3.3 France
- 11.3.4 Italy
- 11.3.5 Spain
- 11.3.6 Russia
- 11.4 Asia Pacific
- 11.4.1 China
- 11.4.2 India
- 11.4.3 Japan
- 11.4.4 South Korea
- 11.4.5 Australia
- 11.5 Latin America
- 11.5.1 Brazil
- 11.5.2 Mexico
- 11.6 MEA
- 11.6.1 South Africa
- 11.6.2 Saudi Arabia
- 11.6.3 UAE
Chapter 12 Company Profiles
- 12.1 ABB Ltd.
- 12.2 AT&T Inc.
- 12.3 AVEVA Group plc.
- 12.4 Cisco Systems, Inc.
- 12.5 Ericsson
- 12.6 Fujitsu Limited
- 12.7 General Electric
- 12.8 Hitachi, Ltd.
- 12.9 Honeywell International Inc.
- 12.10 Huawei Technologies Co., Ltd.
- 12.11 IBM
- 12.12 Intel Corporation
- 12.13 Itron Inc.
- 12.14 Microsoft Corporation
- 12.15 NEC Corporation
- 12.16 Nokia
- 12.17 Oracle Corporation
- 12.18 Schneider Electric SE
- 12.19 Siemens AG
- 12.20 Telefónica S.A.
- 12.21 Verizon
 智慧城市 -市场占有率分析、产业趋势与统计、成长预测(2025-2030 年)
 2025年全球智慧城市平台市场报告2025年智慧城市全球市场报告
 2025 年至 2033 年,智慧城市市场规模、份额、趋势及预测(按重点领域、智慧交通、智慧建筑、智慧公用事业、智慧市民服务和地区划分)
 智慧城市市场:2033 年市场分析与预测 - 按类型、产品、服务、技术、组件、应用、部署、最终用户、解决方案
 智慧城市全球市场,2025-20292025-2033 年日本智慧城市市场报告(依重点领域、智慧交通、智慧建筑、智慧公用事业、智慧公民服务和地区)智慧城市市场:按组成部分、部署区域划分 - 2025-2030 年全球预测
 智慧城市平台市场规模、份额、按产品、交付模式、应用程式和地区分類的成长分析 - 产业预测,2024-2031 年智慧城市市场:按模组、组成部分 - 2025-2030 年全球预测