


 |
市场调查报告书
商品编码
1684788
海鲜加工设备市场机会、成长动力、产业趋势分析与预测 2025 - 2034Seafood Processing Equipment Market Opportunity, Growth Drivers, Industry Trend Analysis, and Forecast 2025 - 2034 |
||||||
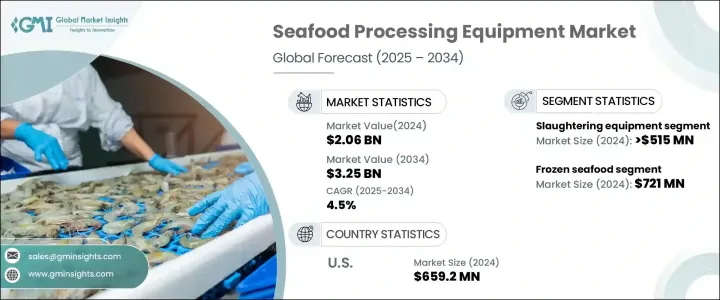
2024 年全球海鲜加工设备市场价值为 20.6 亿美元,预计 2025 年至 2034 年期间将以 4.5% 的复合年增长率稳定成长。人口成长和饮食偏好变化推动了对海鲜的需求不断增长,这是这一增长的主要驱动力。随着消费者的健康意识不断增强,对海鲜健康益处的认识,尤其是其所含的 omega-3 脂肪酸,持续推动海鲜消费量的上升。饮食习惯的转变,加上对永续采购的更加重视,增加了对能够满足效率和环境标准的先进加工解决方案的需求。随着食品加工技术的不断发展,该行业在创新、提高整体生产力和创造符合永续发展目标的产品方面投入了大量资金。
然而,海鲜加工市场面临与环境永续性议题相关的挑战。过度捕捞、兼捕以及加工技术的碳足迹等问题是影响海鲜采购和处理方式的迫切问题。环保意识的增强正在塑造产业趋势,但也带来风险,可能会阻碍某些加工方法的采用。由于企业努力平衡需求和生态责任,这些挑战可能会减缓某些地区的市场成长。
| 市场范围 | |
|---|---|
| 起始年份 | 2024 |
| 预测年份 | 2025-2034 |
| 起始值 | 20.6 亿美元 |
| 预测值 | 32.5亿美元 |
| 复合年增长率 | 4.5% |
屠宰设备部门预计将在 2024 年创造 5.15 亿美元的收入。该部门对于确保海鲜加工商的营运效率并维持严格的卫生标准至关重要。随着海鲜越来越受欢迎以及水产养殖业的扩张,对先进屠宰系统的需求也越来越大。整合自动化的现代化系统有助于降低劳动成本、提高生产力,同时维持高食品安全标准。自动化,特别是在大规模加工操作的地区,可以实现更高的产量和整体效率,使企业能够以更低的营运成本满足不断增长的需求。
2024 年,冷冻海鲜市场的规模估计为 7.21 亿美元,预计到 2034 年复合年增长率将达到 4.5%。冷冻是保存海鲜的首选方法,因为它有助于保持其营养价值并延长保质期。冷冻产品的便利性,加上其能够长期保持品质,使其成为企业和消费者的热门选择。这一趋势凸显了人们对保质期长、易于储存且新鲜度不打折扣的海鲜的持续偏好。
2024 年美国海鲜加工设备市场规模达 6.592 亿美元,占全球市场的主导份额。预测显示,2025 年至 2034 年间美国市场将显着成长,主要得益于海鲜消费量的增加。随着消费者偏好转向即食海鲜产品,如鱼片和冷冻海鲜,对能够大规模高效处理此类产品的加工设备的需求日益增加。
目录
第 1 章:方法论与范围
- 市场范围和定义
- 基础估算与计算
- 预测计算
- 资料来源
- 基本的
- 次要
- 付费来源
- 公共资源
第 2 章:执行摘要
第 3 章:产业洞察
- 产业生态系统分析
- 影响价值链的因素
- 利润率分析
- 中断
- 未来展望
- 製造商
- 经销商
- 供应商概况
- 利润率分析
- 重要新闻及倡议
- 监管格局
- 衝击力
- 成长动力
- 提高消费者对健康益处的认知
- 不断发展的海鲜产业
- 全球海鲜需求不断成长
- 产业陷阱与挑战
- 监理合规性
- 成本压力
- 环境问题
- 成长动力
- 成长潜力分析
- 波特的分析
- PESTEL 分析
第四章:竞争格局
- 介绍
- 公司市占率分析
- 竞争定位矩阵
- 战略展望矩阵
第 5 章:市场规模及预测:按设备类型,2021-2034 年
- 主要趋势
- 屠宰设备
- 吸烟设备
- 固化和填充设备
- 去内臟设备
- 除垢设备
- 剥皮设备
- 切片设备
- 去骨设备
- 其他的
第 6 章:市场规模及预测:按自动化水平,2021-2034 年
- 主要趋势
- 手动的
- 半自动
- 全自动
第 7 章:市场规模与预测:按应用,2021-2034 年
- 主要趋势
- 冷冻海鲜
- 熏製海鲜
- 海鲜罐头
- 干海产
- 鱼糜海鲜
- 其他的
第 8 章:市场规模与预测:依最终用途,2021-2034 年
- 主要趋势
- 海鲜加工厂
- 餐厅及餐饮服务
- 零售
- 其他的
第 9 章:市场规模与预测:按地区,2021-2034 年
- 主要趋势
- 北美洲
- 我们
- 加拿大
- 欧洲
- 英国
- 德国
- 法国
- 义大利
- 西班牙
- 俄罗斯
- 亚太地区
- 中国
- 印度
- 日本
- 韩国
- 澳洲
- 拉丁美洲
- 巴西
- 墨西哥
- 中东及非洲
- 南非
- 沙乌地阿拉伯
- 阿联酋
第十章:公司简介
- Arenco AB
- Baader Group
- Cabinplant A/S
- Cretel NV
- GEA Group AG
- JBT Corporation
- John Bean Technologies (JBT)
- Marel
- Optimar AS
- Raytec Vision SpA
- Sepamatic GmbH
- Skaginn 3X
- The Middleby Corporation
- Trifisk Manufacturing
- Uni-Food Technic A/S
The Global Seafood Processing Equipment Market was valued at USD 2.06 billion in 2024 and is expected to expand at a steady CAGR of 4.5% from 2025 to 2034. The rising demand for seafood, fueled by growing populations and changing dietary preferences, is a primary driver of this growth. As consumers become increasingly health-conscious, the recognition of seafood's health benefits, particularly its omega-3 fatty acid content, continues to boost its consumption. This shift in eating habits, combined with a greater focus on sustainable sourcing, has heightened the need for advanced processing solutions that can meet both efficiency and environmental standards. With the continuous evolution of food processing technologies, the industry is seeing substantial investments in innovation, improving overall productivity, and creating products that align with sustainability goals.
The seafood processing market, however, faces challenges tied to environmental sustainability concerns. Issues such as overfishing, bycatch, and the carbon footprint of processing technologies are pressing matters that influence how seafood is sourced and handled. This increased environmental awareness is shaping industry trends but also poses risks, potentially hindering the adoption of certain processing methods. These challenges may slow the market's growth in some areas as businesses work to balance demand with ecological responsibility.
| Market Scope | |
|---|---|
| Start Year | 2024 |
| Forecast Year | 2025-2034 |
| Start Value | $2.06 Billion |
| Forecast Value | $3.25 Billion |
| CAGR | 4.5% |
The slaughtering equipment segment is projected to generate USD 515 million in 2024. This segment is crucial in ensuring the operational efficiency of seafood processors while maintaining strict hygiene standards. With the growing popularity of seafood and the expansion of aquaculture, there is a significant demand for cutting-edge slaughtering systems. Modern systems, which integrate automation, help reduce labor costs and improve productivity while maintaining high food safety standards. Automation, especially in regions with large-scale processing operations, enables higher throughput and overall efficiency, allowing companies to meet growing demands at a lower operational cost.
In 2024, the frozen seafood segment is estimated to be worth USD 721 million, with expectations for it to grow at a 4.5% CAGR until 2034. Freezing is the preferred method of preserving seafood as it helps retain its nutritional value and extends shelf life. The convenience of frozen products, coupled with their ability to maintain quality over time, has made them a popular choice for both businesses and consumers. This trend highlights the continued preference for long-lasting, easy-to-store seafood options that do not compromise on freshness.
The U.S. seafood processing equipment market reached USD 659.2 million in 2024, holding a dominant share of the global market. Projections show significant growth in the U.S. market between 2025 and 2034, primarily driven by an increase in seafood consumption. As consumer preferences shift toward ready-to-eat seafood products, such as fillets and frozen seafood, there is a rising demand for processing equipment that can efficiently handle large volumes of these products at scale.
Table of Contents
Chapter 1 Methodology & Scope
- 1.1 Market scope & definition
- 1.2 Base estimates & calculations
- 1.3 Forecast calculation
- 1.4 Data sources
- 1.4.1 Primary
- 1.4.2 Secondary
- 1.4.2.1 Paid sources
- 1.4.2.2 Public sources
Chapter 2 Executive Summary
- 2.1 Industry synopsis, 2021-2034
Chapter 3 Industry Insights
- 3.1 Industry ecosystem analysis
- 3.1.1 Factor affecting the value chain
- 3.1.2 Profit margin analysis
- 3.1.3 Disruptions
- 3.1.4 Future outlook
- 3.1.5 Manufacturers
- 3.1.6 Distributors
- 3.2 Supplier landscape
- 3.3 Profit margin analysis
- 3.4 Key news & initiatives
- 3.5 Regulatory landscape
- 3.6 Impact forces
- 3.6.1 Growth drivers
- 3.6.1.1 Increasing consumer awareness on health benefits
- 3.6.1.2 Growing seafood industry
- 3.6.1.3 Rising global demand for seafood
- 3.6.2 Industry pitfalls & challenges
- 3.6.2.1 Regulatory compliance
- 3.6.2.2 Cost pressure
- 3.6.2.3 Environmental concerns
- 3.6.1 Growth drivers
- 3.7 Growth potential analysis
- 3.8 Porter’s analysis
- 3.9 PESTEL analysis
Chapter 4 Competitive Landscape, 2024
- 4.1 Introduction
- 4.2 Company market share analysis
- 4.3 Competitive positioning matrix
- 4.4 Strategic outlook matrix
Chapter 5 Market Size and Forecast, By Equipment Type, 2021-2034 (USD Billion) (Units)
- 5.1 Key trends
- 5.2 Slaughtering equipment
- 5.3 Smoking equipment
- 5.4 Curing and filling equipment
- 5.5 Gutting equipment
- 5.6 Scaling equipment
- 5.7 Skinning equipment
- 5.8 Filleting equipment
- 5.9 Deboning equipment
- 5.10 Others
Chapter 6 Market Size and Forecast, By Automation Level, 2021-2034 (USD Billion) (Units)
- 6.1 Key trends
- 6.2 Manual
- 6.3 Semi-Automatic
- 6.4 Fully automatic
Chapter 7 Market Size and Forecast, By Application, 2021-2034 (USD Billion) (Units)
- 7.1 Key trends
- 7.2 Frozen seafood
- 7.3 Smoked seafood
- 7.4 Canned seafood
- 7.5 Dried seafood
- 7.6 Surimi seafood
- 7.7 Others
Chapter 8 Market Size and Forecast, By End Use, 2021-2034 (USD Billion) (Units)
- 8.1 Key trends
- 8.2 Seafood processing plants
- 8.3 Restaurants & foodservice
- 8.4 Retail
- 8.5 Others
Chapter 9 Market Size and Forecast, By Region, 2021-2034 (USD Billion) (Units)
- 9.1 Key trends
- 9.2 North America
- 9.2.1 U.S.
- 9.2.2 Canada
- 9.3 Europe
- 9.3.1 UK
- 9.3.2 Germany
- 9.3.3 France
- 9.3.4 Italy
- 9.3.5 Spain
- 9.3.6 Russia
- 9.4 Asia Pacific
- 9.4.1 China
- 9.4.2 India
- 9.4.3 Japan
- 9.4.4 South Korea
- 9.4.5 Australia
- 9.5 Latin America
- 9.5.1 Brazil
- 9.5.2 Mexico
- 9.6 MEA
- 9.6.1 South Africa
- 9.6.2 Saudi Arabia
- 9.6.3 UAE
Chapter 10 Company Profiles
- 10.1 Arenco AB
- 10.2 Baader Group
- 10.3 Cabinplant A/S
- 10.4 Cretel NV
- 10.5 GEA Group AG
- 10.6 JBT Corporation
- 10.7 John Bean Technologies (JBT)
- 10.8 Marel
- 10.9 Optimar AS
- 10.10 Raytec Vision S.p.A.
- 10.11 Sepamatic GmbH
- 10.12 Skaginn 3X
- 10.13 The Middleby Corporation
- 10.14 Trifisk Manufacturing
- 10.15 Uni-Food Technic A/S
 全球海鲜加工机械市场规模、份额、趋势及成长分析报告(2026-2034年)
 鱼类加工设备市场规模、份额和成长分析(按设备类型、自动化程度、应用、最终用户和地区划分)-2026-2033年产业预测
 海鲜加工设备市场规模、份额、趋势及预测(依海鲜类型、设备类型、配销通路及地区),2025 年至 2033 年
 渔业机械製造全球市场:2032 年预测 - 按产品、营运模式、动力来源、设备、流程、最终用户和地区进行分析
 全球水产加工设备市场:依类型、产品、设备类型、地区、机会、预测,2018-2032年
 海鲜加工设备市场规模、份额和成长分析(按设备类型、自动化程度、应用、最终用途和地区)- 产业预测 2025-2032
 全球海鲜加工设备市场 2025-2029
 2024-2028年全球海鲜加工设备市场