


 |
市场调查报告书
商品编码
1685202
3D 扫描市场机会、成长动力、产业趋势分析与 2025 - 2034 年预测3D Scanning Market Opportunity, Growth Drivers, Industry Trend Analysis, and Forecast 2025 - 2034 |
||||||
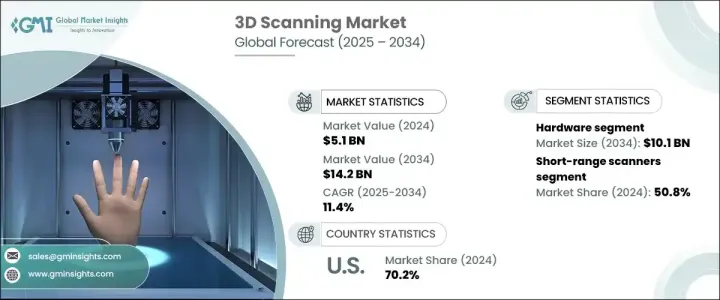
2024 年全球 3D 扫描市场规模将达到 51 亿美元,预计 2025 年至 2034 年期间将以 11.4% 的强劲复合年增长率成长。这一增长是由技术的快速进步和各行各业对 3D 扫描解决方案的日益采用所推动的。随着企业寻求提高准确性、减少错误和简化工作流程,製造业、医疗保健和建筑业对高精度、详细 3D 模型的需求日益增加。随着产业走向数位转型,捕捉三维现实世界资料并将其转换为数位格式的能力变得不可或缺。
逆向工程、品质控制和设计优化等应用正在推动市场扩张,特别是在精度和客製化至关重要的领域。此外,3D扫描在医疗义肢、工业製造和文化遗产保护的发展中发挥着至关重要的作用。扩增实境和虚拟实境等新兴技术也在推动需求,因为逼真的 3D 模型对于游戏、模拟和房地产视觉化中的沉浸式体验至关重要。人工智慧和机器学习与 3D 扫描技术的结合进一步提高了扫描准确性和处理速度,使这些解决方案更加高效,可供各种规模的企业使用。
| 市场范围 | |
|---|---|
| 起始年份 | 2024 |
| 预测年份 | 2025-2034 |
| 起始值 | 51亿美元 |
| 预测值 | 142亿美元 |
| 复合年增长率 | 11.4% |
根据范围,3D 扫描市场分为短程、中程和长程扫描器。 2024年,短距离扫描器将占据产业主导地位,占据50%的市场。这些扫描器非常适合在有限的范围内捕捉小物体的复杂细节,使其成为需要高精度扫描的行业的理想选择。它们在品质保证和原型设计等应用中发挥关键作用,必须准确捕捉每一个细节。短距离扫描器的便携性和与 CAD 软体等数位设计工具的无缝整合使其成为寻求灵活性和高解析度成像的企业的首选。它们的易用性和快速提供精确资料的能力正在加速汽车、航太和消费性电子等产业的应用。
市场还根据组件进行细分,其中硬体和软体是主要类别。预计到 2034 年硬体部门将创造 101 亿美元,凸显其在 3D 扫描过程中的重要角色。先进的硬体解决方案,包括雷射扫描仪、结构光扫描仪和手持扫描仪,正在推动市场扩张。这些设备可以高精度地捕捉实体尺寸,并将其转换为数位格式,以便进一步分析、设计修改和原型设计。随着各行各业越来越依赖数位化工作流程,对高效能 3D 扫描硬体的需求预计将激增。硬体的不断创新,例如超高速和高便携性扫描仪的开发,进一步推动了市场成长。
美国在全球 3D 扫描行业中处于领先地位,到 2024 年将占据 70.2% 的市场份额。该国在技术创新方面的领导地位,加上其多样化的工业格局,正在推动先进扫描解决方案的采用。汽车、航太和医疗保健等高科技产业是市场扩张的主要贡献者。 3D 扫描在医疗应用中的使用日益增多,包括骨科、牙科和个人化义肢,进一步推动了需求。此外,娱乐和房地产等行业正在利用 3D 扫描来创建超现实的虚拟环境,增强增强和虚拟实境应用中的使用者体验。随着人工智慧驱动的 3D 扫描和基于云端的资料处理的不断进步,美国市场将实现持续成长,并成为未来十年创新和应用的中心。
目录
第 1 章:方法论与范围
- 市场范围和定义
- 基础估算与计算
- 预测计算
- 资料来源
- 基本的
- 次要
- 付费来源
- 公共资源
第 2 章:执行摘要
第 3 章:产业洞察
- 产业生态系统分析
- 影响价值链的因素
- 利润率分析
- 中断
- 未来展望
- 製造商
- 经销商
- 供应商概况
- 利润率分析
- 重要新闻及倡议
- 监管格局
- 衝击力
- 成长动力
- 汽车和航太领域的需求不断增长
- 3D 扫描设备的技术进步
- 与扩增实境 (AR) 和虚拟实境 (VR) 的日益融合
- 增加政府和产业投资
- 产业陷阱与挑战
- 初始成本高且复杂性高
- 资料安全和隐私问题
- 成长动力
- 成长潜力分析
- 波特的分析
- PESTEL 分析
第四章:竞争格局
- 介绍
- 公司市占率分析
- 竞争定位矩阵
- 战略展望矩阵
第 5 章:市场估计与预测:按组件,2021 年至 2034 年
- 主要趋势
- 硬体
- 3D 扫描仪
- 配件
- 软体
第六章:市场估计与预测:依范围,2021 年至 2034 年
- 主要趋势
- 短距离扫描仪
- 中距离扫描仪
- 远端扫描仪
第 7 章:市场估计与预测:按类型,2021 年至 2034 年
- 主要趋势
- 雷射扫描仪
- 手持式
- 固定式
- 移动的
- 结构光扫描仪
- 光学扫描仪
- 接触式扫描仪
- 非接触式扫描仪
第 8 章:市场估计与预测:按技术,2021 年至 2034 年
- 主要趋势
- 雷射三角测量
- 飞行时间 (ToF)
- 结构光
- 摄影测量
- 雷射脉衝
第 9 章:市场估计与预测:按最终用途产业,2021 年至 2034 年
- 主要趋势
- 汽车
- 航太和国防
- 消费性电子产品
- 卫生保健
- 石油和天然气
- 能源和电力
- 其他的
第 10 章:市场估计与预测:按地区,2021 年至 2034 年
- 主要趋势
- 北美洲
- 我们
- 加拿大
- 欧洲
- 英国
- 德国
- 法国
- 义大利
- 西班牙
- 俄罗斯
- 亚太地区
- 中国
- 印度
- 日本
- 韩国
- 澳洲
- 拉丁美洲
- 巴西
- 墨西哥
- 中东及非洲
- 南非
- 沙乌地阿拉伯
- 阿联酋
第 11 章:公司简介
- 3D Digital Corporation
- 3D Systems, Inc.
- Artec 3D
- Autodesk, Inc.
- Automated Precision, Inc. (API)
- Carl Zeiss Optotechnik GmbH
- Creaform Inc.
- Direct Dimensions Inc.
- FARO Technologies, Inc.
- GOM GmbH
- Hexagon AB
- Konica Minolta, Inc.
- NextEngine Inc.
- Nikon Corporation
- OGI Systems Ltd
- ShapeGrabber
- Shining3D
- Solutionix
- Topcon Corporation
- Trimble Inc.
- VOXELTEK
The Global 3D Scanning Market reached USD 5.1 billion in 2024 and is projected to expand at a robust CAGR of 11.4% between 2025 and 2034. This surge is driven by rapid technological progress and the increasing adoption of 3D scanning solutions across diverse industries. The demand for high-precision, detailed 3D models is escalating in manufacturing, healthcare, and architecture as businesses look to enhance accuracy, reduce errors, and streamline workflows. As industries move toward digital transformation, the ability to capture real-world data in three dimensions and convert it into digital formats is becoming indispensable.
Applications such as reverse engineering, quality control, and design optimization are fueling market expansion, particularly in sectors where precision and customization are paramount. In addition, 3D scanning is playing a crucial role in the development of medical prosthetics, industrial manufacturing, and cultural heritage preservation. Emerging technologies like augmented and virtual reality are also driving demand as realistic 3D models become essential for immersive experiences in gaming, simulation, and real estate visualization. The integration of artificial intelligence and machine learning with 3D scanning technologies is further enhancing scanning accuracy and processing speed, making these solutions more efficient and accessible for businesses of all sizes.
| Market Scope | |
|---|---|
| Start Year | 2024 |
| Forecast Year | 2025-2034 |
| Start Value | $5.1 Billion |
| Forecast Value | $14.2 Billion |
| CAGR | 11.4% |
By range, the 3D scanning market is categorized into short-range, medium-range, and long-range scanners. In 2024, short-range scanners dominated the industry, capturing 50% of the market share. These scanners are highly preferred for capturing intricate details of small objects within a limited range, making them ideal for industries requiring high-precision scanning. They play a critical role in applications like quality assurance and prototyping, where every fine detail must be accurately captured. The portability and seamless integration of short-range scanners with digital design tools like CAD software makes them a preferred choice for businesses seeking both flexibility and high-resolution imaging. Their ease of use and ability to quickly deliver precise data are accelerating adoption across industries such as automotive, aerospace, and consumer electronics.
The market is also segmented based on components, with hardware and software being the key categories. The hardware segment is expected to generate USD 10.1 billion by 2034, underscoring its fundamental role in 3D scanning processes. Advanced hardware solutions, including laser scanners, structured light scanners, and handheld scanners, are driving market expansion. These devices capture physical dimensions with high accuracy, converting them into digital formats for further analysis, design modifications, and prototyping. As industries increasingly rely on digital workflows, the demand for high-performance 3D scanning hardware is expected to surge. Continuous innovation in hardware, such as the development of ultra-fast and highly portable scanners, is further fueling market growth.
The United States is at the forefront of the global 3D scanning industry, holding a dominant 70.2% market share in 2024. The country's leadership in technological innovation, coupled with its diverse industrial landscape, is propelling the adoption of advanced scanning solutions. High-tech sectors such as automotive, aerospace, and healthcare are among the major contributors to market expansion. The growing use of 3D scanning in medical applications, including orthopedics, dentistry, and personalized prosthetics, is further boosting demand. Additionally, industries like entertainment and real estate are leveraging 3D scanning to create hyper-realistic virtual environments, enhancing user experiences in augmented and virtual reality applications. With the ongoing advancements in AI-driven 3D scanning and cloud-based data processing, the U.S. market is poised for sustained growth, making it a hub for innovation and adoption in the coming decade.
Table of Contents
Chapter 1 Methodology & Scope
- 1.1 Market scope & definitions
- 1.2 Base estimates & calculations
- 1.3 Forecast calculations
- 1.4 Data sources
- 1.4.1 Primary
- 1.4.2 Secondary
- 1.4.2.1 Paid sources
- 1.4.2.2 Public sources
Chapter 2 Executive Summary
- 2.1 Industry synopsis, 2021-2034
Chapter 3 Industry Insights
- 3.1 Industry ecosystem analysis
- 3.1.1 Factor affecting the value chain
- 3.1.2 Profit margin analysis
- 3.1.3 Disruptions
- 3.1.4 Future outlook
- 3.1.5 Manufacturers
- 3.1.6 Distributors
- 3.2 Supplier landscape
- 3.3 Profit margin analysis
- 3.4 Key news & initiatives
- 3.5 Regulatory landscape
- 3.6 Impact forces
- 3.6.1 Growth drivers
- 3.6.1.1 Rising demand in automotive and aerospace sectors
- 3.6.1.2 Technological advancements in 3D scanning devices
- 3.6.1.3 Growing integration with augmented reality (AR) and virtual reality (VR)
- 3.6.1.4 Increased government and industry investments
- 3.6.2 Industry pitfalls & challenges
- 3.6.2.1 High initial costs and complexity
- 3.6.2.2 Data security and privacy concerns
- 3.6.1 Growth drivers
- 3.7 Growth potential analysis
- 3.8 Porter’s analysis
- 3.9 PESTEL analysis
Chapter 4 Competitive Landscape, 2024
- 4.1 Introduction
- 4.2 Company market share analysis
- 4.3 Competitive positioning matrix
- 4.4 Strategic outlook matrix
Chapter 5 Market Estimates & Forecast, By Component, 2021-2034 (USD Billion)
- 5.1 Key trends
- 5.2 Hardware
- 5.2.1 3D Scanners
- 5.2.2 Accessories
- 5.3 Software
Chapter 6 Market Estimates & Forecast, By Range, 2021-2034 (USD Billion)
- 6.1 Key trends
- 6.2 Short-range scanners
- 6.3 Medium-range scanners
- 6.4 Long-range scanners
Chapter 7 Market Estimates & Forecast, By Type, 2021-2034 (USD Billion)
- 7.1 Key trends
- 7.2 Laser scanners
- 7.2.1 Handheld
- 7.2.2 Stationary
- 7.2.3 Mobile
- 7.3 Structured light scanners
- 7.4 Optical scanners
- 7.5 Contact scanners
- 7.6 Non-contact scanners
Chapter 8 Market Estimates & Forecast, By Technology, 2021-2034 (USD Billion)
- 8.1 Key trends
- 8.2 Laser triangulation
- 8.3 Time-of-Flight (ToF)
- 8.4 Structured light
- 8.5 Photogrammetry
- 8.6 Laser pulse
Chapter 9 Market Estimates & Forecast, By End Use Industry, 2021-2034 (USD Billion)
- 9.1 Key trends
- 9.2 Automotive
- 9.3 Aerospace & defense
- 9.4 Consumer electronics
- 9.5 Healthcare
- 9.6 Oil & gas
- 9.7 Energy and power
- 9.8 Others
Chapter 10 Market Estimates & Forecast, By Region, 2021-2034 (USD Billion)
- 10.1 Key trends
- 10.2 North America
- 10.2.1 U.S.
- 10.2.2 Canada
- 10.3 Europe
- 10.3.1 UK
- 10.3.2 Germany
- 10.3.3 France
- 10.3.4 Italy
- 10.3.5 Spain
- 10.3.6 Russia
- 10.4 Asia Pacific
- 10.4.1 China
- 10.4.2 India
- 10.4.3 Japan
- 10.4.4 South Korea
- 10.4.5 Australia
- 10.5 Latin America
- 10.5.1 Brazil
- 10.5.2 Mexico
- 10.6 MEA
- 10.6.1 South Africa
- 10.6.2 Saudi Arabia
- 10.6.3 UAE
Chapter 11 Company Profiles
- 11.1 3D Digital Corporation
- 11.2 3D Systems, Inc.
- 11.3 Artec 3D
- 11.4 Autodesk, Inc.
- 11.5 Automated Precision, Inc. (API)
- 11.6 Carl Zeiss Optotechnik GmbH
- 11.7 Creaform Inc.
- 11.8 Direct Dimensions Inc.
- 11.9 FARO Technologies, Inc.
- 11.10 GOM GmbH
- 11.11 Hexagon AB
- 11.12 Konica Minolta, Inc.
- 11.13 NextEngine Inc.
- 11.14 Nikon Corporation
- 11.15 OGI Systems Ltd
- 11.16 ShapeGrabber
- 11.17 Shining3D
- 11.18 Solutionix
- 11.19 Topcon Corporation
- 11.20 Trimble Inc.
- 11.21 VOXELTEK
 多波束迴声测深仪市场规模、份额和成长分析:按组件、频率、应用、最终用户、地区和产业预测,2026-2033年
 2034年全球3D扫描市场机会与策略
 全球3D扫描市场规模、份额、趋势和成长分析报告(2026-2034年)
 按连接方式、技术、应用、终端用户产业和分销管道分類的坚固型工业手持扫描器市场,全球预测,2026-2032年3D雷射扫描市场-2026-2031年预测
 3D扫描市场规模、份额和成长分析(按产品、范围、组件、最终用途和地区划分)—产业预测,2026-2033年
 2032 年 3D 扫描市场预测:按组件、范围、应用、最终用户和地区进行全球分析
 3D 扫描市场规模、份额、趋势分析报告:按产品、范围、组件、类型、技术、应用、最终用途、地区、细分市场预测,2025 年至 2030 年
 2025 年至 2033 年 3D 扫描市场报告(按类型、范围、应用、最终用途行业和地区)
 3D 扫描的全球市场