


 |
市场调查报告书
商品编码
1698330
数位产品护照市场机会、成长动力、产业趋势分析及 2025-2034 年预测Digital Product Passport Market Opportunity, Growth Drivers, Industry Trend Analysis, and Forecast 2025-2034 |
||||||
2024 年全球数位产品护照市场价值为 1.83 亿美元,预计 2025 年至 2034 年的复合年增长率为 22.6%。对循环经济原则的日益重视促使企业重新思考产品的设计、使用和处置。与传统的线性生产和浪费模型不同,循环经济注重最大限度地减少浪费和最大限度地重复使用材料。数位产品护照是这项转变的核心,提供有关产品成分、来源和可回收性的全面资料。透过在整个生命週期中追踪物品,这些护照使企业能够开发更易于修復、再利用或回收的产品,从而符合全球永续发展目标。
由于透明度和可追溯性成为纺织、电子和汽车等行业的首要任务,世界各国政府正在实施严格的法规,以确保公司采用数位产品护照。欧盟已规定,到2026年,在其管辖范围内销售的所有产品都必须附有数位产品护照。这一监管转变迫使企业整合能够提供有关产品来源、环境足迹和永续性的详细见解的技术,从而加强对不断发展的行业标准的遵守。
| 市场范围 | |
|---|---|
| 起始年份 | 2024 |
| 预测年份 | 2025-2034 |
| 起始值 | 1.83亿美元 |
| 预测值 | 14亿美元 |
| 复合年增长率 | 22.6% |
市场按组件细分为软体和服务。 2024 年,软体占据主导地位,市场占有率超过 60%,预计到 2034 年将超过 9 亿美元。公司越来越多地部署软体解决方案来简化产品资讯管理。人工智慧和区块链的融合对于提高这些解决方案的有效性起到了重要作用。人工智慧提高了资料分析能力,而区块链则确保了记录的安全和不可变,增强了透明度并降低了资料操纵的风险。
市场也根据组织规模分为中小型企业 (SME) 和大型企业。随着製造业、汽车业和电子业等行业继续投资数位产品护照解决方案,大型企业将在 2024 年占据约 60% 的市场份额。这些投资提高了供应链的可视性,监控了产品生命週期,并确保遵守严格的永续法规。此外,企业优先考虑安全且可扩展的解决方案来保护产品资料并在全球营运中无缝整合数位产品护照。
数位产品护照具有多种功能,包括产品可追溯性、永续性和消费者参与度。 2024 年,法规合规性成为最重要的细分市场,贡献了超过 5,000 万美元的价值。各国政府正在为世界各地的产业制定更严格的法规,迫使企业采用记录采购、回收和永续发展工作的可追溯性解决方案。欧盟作为其循环经济行动计划的一部分,对纺织等行业提出了必要的数位化要求,旨在改善环境影响评估并促进永续製造。
市场根据生命週期阶段进一步划分,包括产品设计、分销、生产和报废管理。在监管压力和永续发展措施的推动下,报废产品领域到 2024 年将占据约 30% 的市场份额。公司越来越需要记录产品的处置和回收以满足环境标准。向循环经济的转变提高了对产品生产和使用过程进行追踪的解决方案的需求,以确保负责任的废弃物管理和资源效率。
北美成为领先的区域市场,到 2024 年将占据全球约 35% 的份额。美国处于领先地位,这得益于其在永续性和监管合规方面的大量投资。各行各业的公司正在迅速实施数位产品护照解决方案,以提高透明度、满足行业法规并推动永续发展计画。
目录
第一章:方法论与范围
- 研究设计
- 研究方法
- 资料收集方法
- 基础估算与计算
- 基准年计算
- 市场评估的主要趋势
- 预测模型
- 初步研究和验证
- 主要来源
- 资料探勘来源
- 市场范围和定义
第二章:执行摘要
第三章:行业洞察
- 产业生态系统分析
- 技术提供者
- 监管和认证机构
- 区块链平台
- 最终用途
- 供应商格局
- 利润率分析
- 技术与创新格局
- 专利分析
- 重要新闻和倡议
- 监管格局
- 数位产品护照案例研究
- 衝击力
- 成长动力
- 监管要求不断提高
- 消费者对透明度的需求日益增加
- 推动技术进步
- 扩大循环经济倡议
- 产业陷阱与挑战
- 数据标准化和互通性
- 实施成本和复杂性
- 成长动力
- 成长潜力分析
- 波特的分析
- PESTEL 分析
第四章:竞争格局
- 介绍
- 公司市占率分析
- 竞争定位矩阵
- 战略展望矩阵
第五章:市场估计与预测:按组件,2021 - 2034 年
- 主要趋势
- 软体
- 服务
- 咨询
- 整合与部署
- 支援与维护
第六章:市场估计与预测:依组织规模,2021 - 2034 年
- 主要趋势
- 中小企业
- 大型企业
第七章:市场估计与预测:按应用,2021 - 2034 年
- 主要趋势
- 产品可追溯性
- 永续性
- 监理合规性
- 消费者参与
第八章:市场估计与预测:依垂直产业,2021 - 2034 年
- 主要趋势
- 汽车
- 消费性电子产品
- 纺织品和服装
- 製药
- 食品和饮料
- 包装
- 其他的
第九章:市场估计与预测:依生命週期阶段,2021 - 2034 年
- 主要趋势
- 产品设计
- 分配
- 生产
- 生命终点
第十章:市场估计与预测:按地区,2021 - 2034 年
- 主要趋势
- 北美洲
- 我们
- 加拿大
- 欧洲
- 英国
- 德国
- 法国
- 义大利
- 西班牙
- 俄罗斯
- 北欧人
- 亚太地区
- 中国
- 印度
- 日本
- 澳洲
- 韩国
- 东南亚
- 拉丁美洲
- 巴西
- 墨西哥
- 阿根廷
- 中东及非洲
- 阿联酋
- 南非
- 沙乌地阿拉伯
第 11 章:公司简介
- Avery Dennison
- Billon Group
- Circularise
- CIRPASS Consortium
- Det Norske Veritas Group (DNV)
- Eon
- Everledger
- Gemalto
- GS1
- IBM
- iPoint-systems
- Kezzler
- LyondellBasell
- Microsoft
- PSQR (Product Safety & Quality Right)
- R3
- SAP
- Siemens
- Spherity
- Zebra Technologies
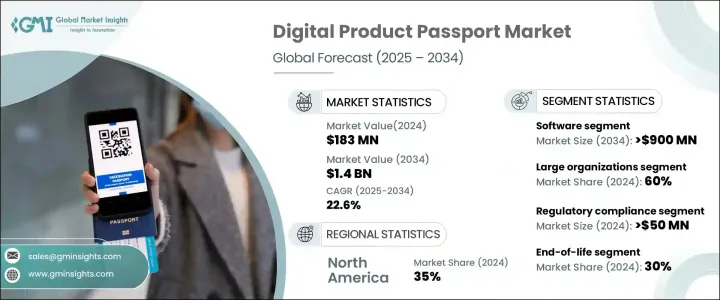
The Global Digital Product Passport Market was valued at USD 183 million in 2024 and is projected to grow at a CAGR of 22.6% from 2025 to 2034. The rising emphasis on circular economic principles is prompting businesses to rethink product design, usage, and disposal. Unlike the traditional linear model of production and waste, a circular economy focuses on minimizing waste and maximizing material reuse. Digital Product Passports are central to this transition, offering comprehensive data on a product's composition, sourcing, and recyclability. By tracking items throughout their lifecycle, these passports enable businesses to develop products that are easier to repair, reuse, or recycle, aligning with global sustainability goals.
Governments worldwide are enforcing strict regulations to ensure companies adopt digital product passports, as transparency and traceability become top priorities in industries such as textiles, electronics, and automotive. The European Union has mandated that all products sold within its jurisdiction must carry a Digital Product Passport by 2026. This regulatory shift is compelling businesses to integrate technologies that provide detailed insights into a product's origin, environmental footprint, and sustainability, reinforcing compliance with evolving industry standards.
| Market Scope | |
|---|---|
| Start Year | 2024 |
| Forecast Year | 2025-2034 |
| Start Value | $183 Million |
| Forecast Value | $1.4 Billion |
| CAGR | 22.6% |
The market is segmented by component into software and services. In 2024, software dominated, with over 60% of the market share, and is anticipated to surpass USD 900 million by 2034. Companies increasingly deploy software solutions to streamline product information management. The integration of artificial intelligence and blockchain has been instrumental in enhancing the effectiveness of these solutions. AI improves data analysis capabilities, while blockchain ensures secure and immutable records, strengthening transparency and reducing data manipulation risks.
The market is also categorized by organization size into small and medium enterprises (SME) and large corporations. Large enterprises held approximately 60% of the market share in 2024, as industries such as manufacturing, automotive, and electronics continue to invest in digital product passport solutions. These investments enhance supply chain visibility, monitor product life cycles, and ensure adherence to stringent sustainability regulations. Additionally, enterprises prioritize secure and scalable solutions to protect product data and integrate digital product passports seamlessly across global operations.
Digital product passports serve multiple functions, including product traceability, sustainability, and consumer engagement. In 2024, regulatory compliance represented the most significant market segment, contributing over USD 50 million in value. Governments are introducing stricter regulations for industries worldwide, compelling businesses to adopt traceability solutions that document sourcing, recycling, and sustainability efforts. The European Union, as part of its Circular Economy Action Plan, has introduced essential digital requirements for industries such as textiles, aiming to improve environmental impact assessments and promote sustainable manufacturing.
The market is further divided based on life cycle stages, including product design, distribution, production, and end-of-life management. The end-of-life segment accounted for around 30% of the market in 2024, driven by regulatory pressures and sustainability initiatives. Companies are increasingly required to document the disposal and recycling of products to meet environmental standards. The shift toward a circular economy has heightened demand for solutions that track products beyond production and usage, ensuring responsible waste management and resource efficiency.
North America emerged as the leading regional market, holding approximately 35% of the global share in 2024. The United States is at the forefront, driven by substantial investments in sustainability and regulatory compliance. Companies across various industries are swiftly implementing digital product passport solutions to enhance transparency, meet industry regulations, and advance sustainability initiatives.
Table of Contents
Chapter 1 Methodology & Scope
- 1.1 Research design
- 1.1.1 Research approach
- 1.1.2 Data collection methods
- 1.2 Base estimates & calculations
- 1.2.1 Base year calculation
- 1.2.2 Key trends for market estimation
- 1.3 Forecast model
- 1.4 Primary research and validation
- 1.4.1 Primary sources
- 1.4.2 Data mining sources
- 1.5 Market scope & definition
Chapter 2 Executive Summary
- 2.1 Industry synopsis, 2021 - 2034
Chapter 3 Industry Insights
- 3.1 Industry ecosystem analysis
- 3.1.1 Technology providers
- 3.1.2 Regulatory and certification bodies
- 3.1.3 Blockchain platforms
- 3.1.4 End use
- 3.2 Supplier landscape
- 3.3 Profit margin analysis
- 3.4 Technology & innovation landscape
- 3.5 Patent analysis
- 3.6 Key news & initiatives
- 3.7 Regulatory landscape
- 3.8 Case study of digital product passport
- 3.9 Impact forces
- 3.9.1 Growth drivers
- 3.9.1.1 Rising regulatory requirements
- 3.9.1.2 Increasing consumer demand for transparency
- 3.9.1.3 Advancing technological advancements
- 3.9.1.4 Expanding circular economy initiatives
- 3.9.2 Industry pitfalls & challenges
- 3.9.2.1 Data standardization and interoperability
- 3.9.2.2 Cost and complexity of implementation
- 3.9.1 Growth drivers
- 3.10 Growth potential analysis
- 3.11 Porter’s analysis
- 3.12 PESTEL analysis
Chapter 4 Competitive Landscape, 2024
- 4.1 Introduction
- 4.2 Company market share analysis
- 4.3 Competitive positioning matrix
- 4.4 Strategic outlook matrix
Chapter 5 Market Estimates & Forecast, By Component, 2021 - 2034 ($ Million)
- 5.1 Key trends
- 5.2 Software
- 5.3 Services
- 5.3.1 Consulting
- 5.3.2 Integration & deployment
- 5.3.3 Support & maintenance
Chapter 6 Market Estimates & Forecast, By Organization Size, 2021 - 2034 ($ Million)
- 6.1 Key trends
- 6.2 SME
- 6.3 Large enterprises
Chapter 7 Market Estimates & Forecast, By Application, 2021 - 2034 ($ Million)
- 7.1 Key trends
- 7.2 Product traceability
- 7.3 Sustainability
- 7.4 Regulatory compliance
- 7.5 Consumer engagement
Chapter 8 Market Estimates & Forecast, By Vertical, 2021 - 2034 ($ Million)
- 8.1 Key trends
- 8.2 Automotive
- 8.3 Consumer electronics
- 8.4 Textiles and apparel
- 8.5 Pharmaceuticals
- 8.6 Food & beverage
- 8.7 Packaging
- 8.8 Others
Chapter 9 Market Estimates & Forecast, By Lifecycle Stage, 2021 - 2034 ($ Million)
- 9.1 Key trends
- 9.2 Product design
- 9.3 Distribution
- 9.4 Production
- 9.5 End of life
Chapter 10 Market Estimates & Forecast, By Region, 2021 - 2034 ($ Million)
- 10.1 Key trends
- 10.2 North America
- 10.2.1 U.S.
- 10.2.2 Canada
- 10.3 Europe
- 10.3.1 UK
- 10.3.2 Germany
- 10.3.3 France
- 10.3.4 Italy
- 10.3.5 Spain
- 10.3.6 Russia
- 10.3.7 Nordics
- 10.4 Asia Pacific
- 10.4.1 China
- 10.4.2 India
- 10.4.3 Japan
- 10.4.4 Australia
- 10.4.5 South Korea
- 10.4.6 Southeast Asia
- 10.5 Latin America
- 10.5.1 Brazil
- 10.5.2 Mexico
- 10.5.3 Argentina
- 10.6 MEA
- 10.6.1 UAE
- 10.6.2 South Africa
- 10.6.3 Saudi Arabia
Chapter 11 Company Profiles
- 11.1 Avery Dennison
- 11.2 Billon Group
- 11.3 Circularise
- 11.4 CIRPASS Consortium
- 11.5 Det Norske Veritas Group (DNV)
- 11.6 Eon
- 11.7 Everledger
- 11.8 Gemalto
- 11.9 GS1
- 11.10 IBM
- 11.11 iPoint-systems
- 11.12 Kezzler
- 11.13 LyondellBasell
- 11.14 Microsoft
- 11.15 PSQR (Product Safety & Quality Right)
- 11.16 R3
- 11.17 SAP
- 11.18 Siemens
- 11.19 Spherity
- 11.20 Zebra Technologies
 数位产品护照软体市场-全球产业规模、份额、趋势、机会、预测:按部署方式、公司规模、产业、地区和竞争对手划分,2021-2031年
 2025年全球数位健康通行证市场报告
 全球数位产品护照市场:预测至 2032 年-按组件、部署方式、组织规模、应用、最终用户和地区进行分析
 全球数位产品护照市场:市场规模、份额、趋势分析(按部署方式、产品、产业和地区)、展望与未来预测(2025-2032 年)
 全球数位产品护照软体市场
 数位产品护照市场规模、份额、趋势分析报告:按产品、部署、行业垂直、地区、细分市场预测,2025 年至 2030 年
 全球数位产品护照 (DPP) 市场,按重点领域和生命週期阶段划分 - 预测至 2030 年
 全球数位产品护照软体市场 2024-2031
 数位产品护照(DPP)的全球市场的考察,预测(~2030年)
 数位产品护照