


 |
市场调查报告书
商品编码
1698549
农光伏市场机会、成长动力、产业趋势分析及2025-2034年预测Agrivoltaic Market Opportunity, Growth Drivers, Industry Trend Analysis, and Forecast 2025-2034 |
||||||
2024 年全球农业光电市场价值为 63 亿美元,预计 2025 年至 2034 年期间的复合年增长率为 5.6%。与农业活动相结合的大型太阳能装置的日益普及正在推动这一扩张。透过提供部分遮荫,太阳能板可以保护农作物和牲畜免受极端高温和干旱的影响,从而提高农业经济的生产力。政府和私人企业不断推出鼓励具有成本效益的共置模式的资助计划,重塑产业格局。此外,世界各地正在建立监管框架,以标准化安装并确保可持续部署。法国、德国、义大利等已开发经济体正积极引进农光伏系统,以优化土地利用、提高能源效率。农业用地优化的需求日益增长,尤其是在土地稀缺的地区,这推动了农业用地优化的应用,而各个地区广阔的农业景观和充足的阳光进一步促进了该行业的扩张。
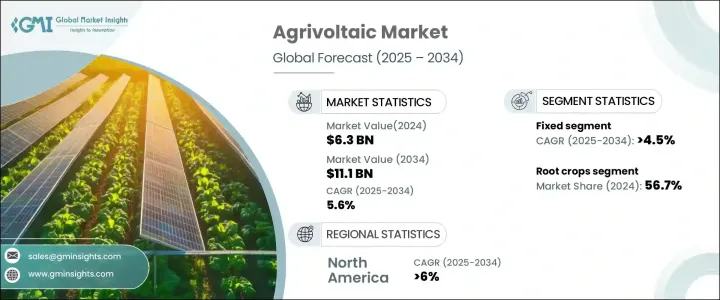
农业光电系统促进粮食和电力的高效生产,促进经济成长。安装在植被上方的太阳能电池板在较低的温度下运行,从而提高了效率并增强了整体能量输出。按系统设计进行的市场细分包括固定结构和动态结构,每种结构都有助于土地优化,而不会扰乱农业活动。固定农业光电系统的价值在 2022 年为 55 亿美元,2023 年为 59 亿美元,2024 年为 63 亿美元,预计到 2034 年将以 4.5% 的复合年增长率成长。对可靠且经济高效的太阳能解决方案的需求正在加速采用,而对简化安装流程的需求正在进一步推动市场渗透。对更高能源产量和更高作物生产率的追求正在增加动态系统的部署,而追踪机制的创新则提高了整体性能。
| 市场范围 | |
|---|---|
| 起始年份 | 2024 |
| 预测年份 | 2025-2034 |
| 起始值 | 63亿美元 |
| 预测值 | 111亿美元 |
| 复合年增长率 | 5.6% |
根据收穫类型,市场包括根茎作物、蔬菜和水果。 2024 年,块根作物占据了 56.7% 的市场份额,预计到 2032 年将以超过 6% 的复合年增长率增长。太阳能板能够最大限度地减少水分蒸发,同时保持稳定的土壤湿度,这是其一个关键优势,目前的研究正在确定更多适合农光伏农业的作物品种。由于农民寻求额外的收入来源并专注于永续的农业方法,蔬菜占了近 20% 的市场。由于蒸发率降低、小气候改善以及农民收入潜力提高,农业光伏水果产业正在获得发展动力。探索多种应用的试点计画继续增加人们对该技术的兴趣。
在美国,农业光电市场规模在 2022 年达到 6.8 亿美元,2023 年达到 7.2 亿美元,2024 年达到 7.7 亿美元。预计到 2034 年,北美市场将以超过 6% 的复合年增长率扩张,这得益于不断增长的太阳能需求和有限的土地供应。智慧农业光伏系统旨在监测作物健康状况和优化能源生产,它正在促进这一增长,使该地区成为先进太阳能农业一体化的关键市场。
目录
第一章:方法论与范围
- 市场定义
- 基础估算与计算
- 预测计算
- 资料来源
- 基本的
- 次要
- 付费来源
- 未付费来源
第二章:执行摘要
第三章:行业洞察
- 产业生态系统分析
- 供应商矩阵
- 监管格局
- 产业衝击力
- 成长动力
- 产业陷阱与挑战
- COVID-19 对产业前景的影响
- 成长潜力分析
- 波特的分析
- PESTEL 分析
第四章:竞争格局
- 战略仪表板
- 创新与永续发展格局
第五章:市场规模及预测:依系统设计,2021 年至 2034 年
- 主要趋势
- 固定的
- 动态的
第六章:市场规模及预测:依收穫类型,2021 年至 2034 年
- 主要趋势
- 块根作物
- 蔬菜
- 水果
第七章:市场规模及预测:依地区划分,2021 年至 2034 年
- 主要趋势
- 独立
- 遮阳网
- 温室
- 其他的
第八章:市场规模及预测:按地区,2021 年至 2034 年
- 主要趋势
- 北美洲
- 我们
- 加拿大
- 墨西哥
- 欧洲
- 奥地利
- 挪威
- 丹麦
- 芬兰
- 法国
- 亚太地区
- 中国
- 澳洲
- 印度
- 韩国
- 世界其他地区
第九章:公司简介
- TotalEnergies
- Agrivoltaic Solution LLC
- Cero Generation Limited
- Sun'Agr
- iSun, Inc.
- REM TEC
- Trina Solar
- Jinko Solar
- VALOREM
- SunPower Corporation
- Next2Sun
- Enel Spa
- Solaria
- Waaree Energies Ltd.
- Insolight
- Vattenfall AB
- Chint New Energy Technology Co., Ltd.
The Global Agrivoltaic Market, valued at USD 6.3 billion in 2024, is projected to grow at a 5.6% CAGR from 2025 to 2034. The increasing adoption of large-scale solar installations integrated with agricultural activities is driving this expansion. By providing partial shade, solar panels protect crops and livestock from extreme heat and drought, enhancing productivity in agrarian economies. Governments and private enterprises continue to introduce funding initiatives that encourage cost-effective co-location models, reshaping the industry landscape. Additionally, regulatory frameworks are being established worldwide to standardize installations and ensure sustainable deployment. Developed economies, including France, Germany, and Italy, are actively incorporating agrivoltaic systems to optimize land use and improve energy efficiency. The rising need for agricultural land optimization, particularly in land-scarce regions, is fueling adoption, while extensive agricultural landscapes and abundant sunlight in various regions further boost the industry's expansion.
Agrivoltaic systems facilitate the efficient production of food and electricity, contributing to economic growth. The panels installed over vegetation operate at lower temperatures, improving efficiency and enhancing overall energy output. Market segmentation by system design includes fixed and dynamic structures, each contributing to land optimization without disrupting farming activities. Fixed agrivoltaic systems, valued at USD 5.5 billion in 2022, USD 5.9 billion in 2023, and USD 6.3 billion in 2024, are expected to grow at a 4.5% CAGR through 2034. The demand for reliable and cost-effective solar energy solutions is accelerating adoption, while the need for simplified installation processes is further driving market penetration. The push for higher energy yields and improved crop productivity is increasing the deployment of dynamic systems, with innovations in tracking mechanisms enhancing overall performance.
| Market Scope | |
|---|---|
| Start Year | 2024 |
| Forecast Year | 2025-2034 |
| Start Value | $6.3 Billion |
| Forecast Value | $11.1 Billion |
| CAGR | 5.6% |
By harvest type, the market includes root crops, vegetables, and fruits. Root crops represented 56.7% of the market in 2024 and are projected to grow at over 6% CAGR through 2032. The ability of solar panels to minimize water evaporation while maintaining stable soil moisture is a key advantage, with ongoing research identifying additional crop varieties suited for agrivoltaic farming. Vegetables accounted for nearly 20% of the market, as farmers seek additional revenue streams and focus on sustainable farming methods. The agrivoltaic fruit sector is gaining traction due to reduced evaporation rates, improved microclimates, and enhanced income potential for farmers. Pilot projects exploring diverse applications continue to increase interest in the technology.
In the U.S., the agrivoltaic market reached USD 680 million in 2022, USD 720 million in 2023, and USD 770 million in 2024. North America's market is forecasted to expand at a CAGR exceeding 6% through 2034, driven by growing solar energy demand and limited land availability. Smart agrivoltaic systems, designed for monitoring crop health and optimizing energy production, are contributing to this growth, positioning the region as a key market for advanced solar-agriculture integration.
Table of Contents
Chapter 1 Methodology & Scope
- 1.1 Market definitions
- 1.2 Base estimates & calculations
- 1.3 Forecast calculation
- 1.4 Data sources
- 1.4.1 Primary
- 1.4.2 Secondary
- 1.4.2.1 Paid sources
- 1.4.2.2 Unpaid sources
Chapter 2 Executive Summary
- 2.1 Industry 360° synopsis, 2021 – 2034
Chapter 3 Industry Insights
- 3.1 Industry ecosystem analysis
- 3.1.1 Vendor Matrix
- 3.2 Regulatory landscape
- 3.3 Industry impact forces
- 3.3.1 Growth drivers
- 3.3.2 Industry pitfalls & challenges
- 3.4 COVID- 19 impact on the industry outlook
- 3.5 Growth potential analysis
- 3.6 Porter's Analysis
- 3.6.1 Bargaining power of suppliers
- 3.6.2 Bargaining power of buyers
- 3.6.3 Threat of new entrants
- 3.6.4 Threat of substitutes
- 3.7 PESTEL Analysis
Chapter 4 Competitive landscape, 2024
- 4.1 Strategic dashboard
- 4.2 Innovation & sustainability landscape
Chapter 5 Market Size and Forecast, By System Design, 2021 – 2034 (USD Million)
- 5.1 Key trends
- 5.2 Fixed
- 5.3 Dynamic
Chapter 6 Market Size and Forecast, By Harvest Type, 2021 – 2034 (USD Million)
- 6.1 Key trends
- 6.2 Root crops
- 6.3 Vegetables
- 6.4 Fruits
Chapter 7 Market Size and Forecast, By Placement, 2021 – 2034 (USD Million)
- 7.1 Key trends
- 7.2 Standalone
- 7.3 Shading nets
- 7.4 Greenhouses
- 7.5 Others
Chapter 8 Market Size and Forecast, By Region, 2021 – 2034 (USD million)
- 8.1 Key trends
- 8.2 North America
- 8.2.1 U.S.
- 8.2.2 Canada
- 8.2.3 Mexico
- 8.3 Europe
- 8.3.1 Austria
- 8.3.2 Norway
- 8.3.3 Denmark
- 8.3.4 Finland
- 8.3.5 France
- 8.4 Asia Pacific
- 8.4.1 China
- 8.4.2 Australia
- 8.4.3 India
- 8.4.4 South Korea
- 8.5 Rest of World
Chapter 9 Company Profiles
- 9.1 TotalEnergies
- 9.2 Agrivoltaic Solution LLC
- 9.3 Cero Generation Limited
- 9.4 Sun’Agr
- 9.5 iSun, Inc.
- 9.6 REM TEC
- 9.7 Trina Solar
- 9.8 Jinko Solar
- 9.9 VALOREM
- 9.10 SunPower Corporation
- 9.11 Next2Sun
- 9.12 Enel Spa
- 9.13 Solaria
- 9.14 Waaree Energies Ltd.
- 9.15 Insolight
- 9.16 Vattenfall AB
- 9.17 Chint New Energy Technology Co., Ltd.
 2026年全球农场太阳能发电市场报告
 农光互补:市场占有率分析、产业趋势与统计、成长预测(2026-2031)
 全球农光互补市场(至 2035 年):依系统设计类型、技术类型、作物类型、安装类型、应用类型、地区、产业趋势与预测
 农业太阳能市场-全球产业规模、份额、趋势、机会及预测(按阵列配置、太阳能电池技术、安装地点、地区和竞争格局划分,2021-2031年)
 农光互补市场规模、份额和成长分析(按系统设计、作物类型、安装方式、材料类型、电池类型和地区划分)-2026-2033年产业预测
 全球农光电市场
 农业光电市场:未来预测(2025-2030)
 农业光电市场:依系统类型、电池类型、作物类型、地区、机会、预测,2018-2032年印度的农业光伏市场评估:系统类型·电池单元类型·作物类型·各地区的机会及预测 (2018-2032年)
 亚太农业光伏市场:按产品和国家分類的趋势 - 分析和预测(2023-2033)