


 |
市场调查报告书
商品编码
1698604
电影院市场机会、成长动力、产业趋势分析及 2025-2034 年预测Drive in Movie Theater Market Opportunity, Growth Drivers, Industry Trend Analysis, and Forecast 2025-2034 |
||||||
2024 年,全球汽车电影院市场规模达到 53 亿美元,预计 2025 年至 2034 年的复合年增长率将达到 6.6%。随着年轻人和中年人群越来越被独特的户外电影体验所吸引,该市场正在经历復苏。虽然中年消费者往往被汽车剧院的怀旧氛围所吸引,但年轻观众却被汽车剧院的社交和社区中心特色所吸引。在新冠疫情期间,随着人们寻求保持社交距离的娱乐方式,汽车剧院的受欢迎程度激增,而且这种趋势仍在持续。推动成长的关键因素包括可支配收入的增加、汽车拥有量的增加以及投影系统和行动票务的技术进步。 2023 年美国可支配个人收入的成长进一步支持了休閒活动支出(包括汽车电影院体验)的成长趋势。
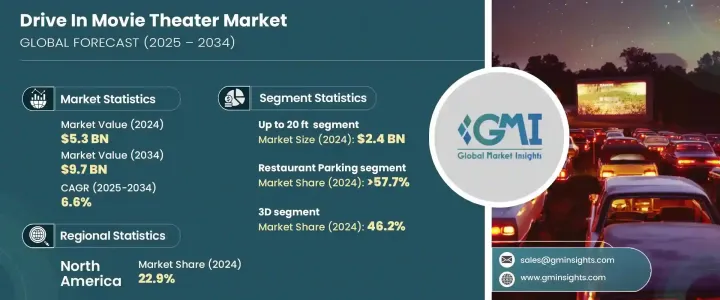
就萤幕尺寸而言,市场分为三类:20 英尺以下、20-50 英尺和 50 英尺以上。 20 英尺以下部分在 2024 年创造了 24 亿美元的收入,预计到 2034 年的复合年增长率为 7.2%。这种萤幕尺寸特别受欢迎,因为它平衡了成本、空间和观赏质量,使其成为小型和独立汽车剧院的理想选择。它为各种车辆类型提供清晰的观看体验,并为近距离和远距离观众保持影像品质。 20 英尺萤幕的怀旧氛围吸引着电影观众,同时仍然适应现代技术。
| 市场范围 | |
|---|---|
| 起始年份 | 2024 |
| 预测年份 | 2025-2034 |
| 起始值 | 53亿美元 |
| 预测值 | 97亿美元 |
| 复合年增长率 | 6.6% |
从场地类型来看,汽车电影院市场分为餐厅停车场和剧院停车场。餐厅停车场部分占 2024 年收入的 57.7% 以上,预计到 2034 年将以 6.8% 的复合年增长率增长。这些场所为餐厅提供了一个独特的机会,可以将其停车场改造成户外电影场所,这有助于增加客流量并产生额外的收入。由于对提供安全和社交距离的露天娱乐空间的需求不断增加,这一趋势得到了发展。
市场也按技术细分,其中 2D 和 3D 电影是主要选择。预计到 2024 年,3D 领域将占据 46.2% 的显着份额。随着偏光 3D 和数位投影技术的进步,汽车影院能够提供增强的观看体验。这些创新,加上消费者对高端娱乐的兴趣,推动了汽车剧院对 3D 放映的需求不断增长。
北美在汽车电影院市场占据主导地位,到 2024 年将贡献总收入的 22.9%,即 12 亿美元。该地区正在经历汽车影院的復兴,文化和技术因素在其持续成功中发挥关键作用。可支配收入的增加和对户外娱乐体验的偏好促进了市场的成长。
目录
第一章:方法论与范围
- 研究设计
- 研究方法
- 资料收集方法
- 基础估算与计算
- 基准年计算
- 市场估计的主要趋势
- 预测模型
- 初步研究与验证
- 主要来源
- 资料探勘来源
- 市场定义
第二章:执行摘要
第三章:行业洞察
- 产业生态系统分析
- 供应商格局
- 定价分析
- 技术与创新格局
- 重要新闻和倡议
- 监管格局
- 製造商
- 经销商
- 衝击力
- 成长动力
- 融入先进技术并改善免下车区域
- 餐厅停车场被广泛用于汽车电影院
- 消费支出不断增长以及娱乐产业的数位化
- 产业陷阱与挑战
- 季节性和天气依赖性
- 初始设定成本高
- 成长动力
- 成长潜力分析
- 消费者购买行为
- 波特的分析
- PESTEL分析
第四章:竞争格局
- 介绍
- 公司市占率分析
- 竞争定位矩阵
- 战略展望矩阵
第五章:市场估计与预测:按萤幕尺寸,2021 - 2034 年
- 主要趋势
- 高达 20 英尺
- 20-50英尺
- 50 英尺以上
第六章:市场估计与预测:按地区,2021 - 2034 年
- 主要趋势
- 小规模
- 大规模
第七章:市场估计与预测:依技术分类,2021 - 2034 年
- 主要趋势
- 2D
- 3D
第八章:市场估计与预测:按价格,2021 - 2034 年(十亿美元)
- 主要趋势
- 低的
- 中等的
- 高的
第九章:市场估计与预测:按应用,2021 - 2034 年
- 主要趋势
- 餐厅停车场
- 剧院停车场
第十章:市场估计与预测:按地区,2021 - 2034 年
- 主要趋势
- 北美洲
- 美国
- 加拿大
- 欧洲
- 英国
- 德国
- 法国
- 义大利
- 西班牙
- 俄罗斯
- 北欧人
- 亚太地区
- 中国
- 印度
- 日本
- 澳洲
- 韩国
- 东南亚
- 拉丁美洲
- 巴西
- 墨西哥
- 阿根廷
- 玛米亚
- 阿联酋
- 南非
- 沙乌地阿拉伯
第 11 章:公司简介
- Capri Drive-In
- Coyote Drive-In and Canteen
- Delsea Drive-In
- Field of Dreams Drive-In
- Galaxy Drive-In
- Hull's Drive-In
- Malco Theatres
- Mesa Drive-In
- Shankweiler's Drive-In
- South Bay Drive-In
- Star Drive-In
- Starlight Cinemas
- Sunset Cinema Club
- Van Buren Drive-In
- Wellfleet Drive-In
The Global Drive In Movie Theater Market reached USD 5.3 billion in 2024 and is anticipated to grow at 6.6% CAGR from 2025 to 2034. This market is experiencing a resurgence as both younger and middle-aged groups are increasingly drawn to the unique outdoor movie experience. While middle-aged consumers often gravitate toward the nostalgic ambiance of drive-ins, younger audiences are attracted to the social and community-focused aspects of the events. The popularity of drive-in theaters surged during the COVID-19 pandemic as people sought socially distanced entertainment, and the trend continues to thrive. Key factors driving growth include greater disposable income, rising auto ownership, and technological advancements in projection systems and mobile ticketing. The increase in disposable personal income in the U.S. in 2023 further supports the growing trend of spending on leisure activities, including drive-in movie experiences.
In terms of screen size, the market is divided into three categories: up to 20 ft, 20-50 ft, and above 50 ft. The up to 20 ft segment generated USD 2.4 billion in 2024, with a forecasted CAGR of 7.2% through 2034. This screen size is particularly popular because it balances cost, space, and viewing quality, making it an ideal choice for small and independent drive-in theaters. It offers a clear viewing experience for various vehicle types and maintains image quality for both closer and distant viewers. The nostalgic vibe of the 20-foot screen appeals to moviegoers while still accommodating modern-day technology.
| Market Scope | |
|---|---|
| Start Year | 2024 |
| Forecast Year | 2025-2034 |
| Start Value | $5.3 Billion |
| Forecast Value | $9.7 Billion |
| CAGR | 6.6% |
Regarding venue types, the drive-in movie theater market is categorized into restaurant parking lots and theater parking lots. The restaurant parking lots segment accounted for over 57.7% of revenue in 2024 and is projected to grow at 6.8% CAGR until 2034. These venues offer a unique opportunity for restaurants to convert their parking lots into outdoor movie venues, which helps boost their traffic and generate additional revenue. This trend has gained traction due to the increasing demand for open-air entertainment spaces that offer safety and social distancing.
The market is also segmented by technology, with 2D and 3D films being the main options. The 3D segment is expected to hold a significant share of 46.2% in 2024. With advances in polarized 3D and digital projection technology, drive-in theaters are able to deliver enhanced viewing experiences. These innovations, combined with consumer interest in premium entertainment, are driving the growing demand for 3D screenings at drive-ins.
North America holds a dominant share in the drive-in movie theater market, contributing 22.9% of the total revenue in 2024, or USD 1.2 billion. This region is witnessing a revival of drive-in theaters, with cultural and technological factors playing a key role in their ongoing success. The rising disposable income and preference for outdoor entertainment experiences are contributing to market growth.
Table of Contents
Chapter 1 Methodology & Scope
- 1.1 Research design
- 1.1.1 Research approach
- 1.1.2 Data collection methods
- 1.2 Base estimates and calculations
- 1.2.1 Base year calculation
- 1.2.2 Key trends for market estimates
- 1.3 Forecast model
- 1.4 Primary research & validation
- 1.4.1 Primary sources
- 1.4.2 Data mining sources
- 1.5 Market definitions
Chapter 2 Executive Summary
- 2.1 Industry synopsis, 2021 - 2034
Chapter 3 Industry Insights
- 3.1 Industry ecosystem analysis
- 3.2 Supplier landscape
- 3.3 Pricing analysis
- 3.4 Technology & innovation landscape
- 3.5 Key news & initiatives
- 3.6 Regulatory landscape
- 3.7 Manufacturers
- 3.8 Distributors
- 3.9 Impact forces
- 3.9.1 Growth drivers
- 3.9.1.1 Incorporation of advanced technologies and enhancement of drive-through areas
- 3.9.1.2 Wide usage of restaurant parking lots for drive-in movie theatres
- 3.9.1.3 Rising consumer spending as well as digitization in the entertainment industry
- 3.9.2 Industry pitfalls & challenges
- 3.9.2.1 Seasonal nature and weather dependence
- 3.9.2.2 High initial setup costs
- 3.9.1 Growth drivers
- 3.10 Growth potential analysis
- 3.11 Consumer buying behavior
- 3.12 Porter's analysis
- 3.13 PESTEL analysis
Chapter 4 Competitive Landscape, 2024
- 4.1 Introduction
- 4.2 Company market share analysis
- 4.3 Competitive positioning matrix
- 4.4 Strategic outlook matrix
Chapter 5 Market Estimates & Forecast, By Screen Size, 2021 - 2034 ($Bn)
- 5.1 Key trends
- 5.2 Up to 20 ft
- 5.3 20-50 ft
- 5.4 Above 50 ft
Chapter 6 Market Estimates & Forecast, By Area, 2021 - 2034 ($Bn)
- 6.1 Key trends
- 6.2 Small scale
- 6.3 Large scale
Chapter 7 Market Estimates & Forecast, By Technology, 2021 - 2034 ($Bn)
- 7.1 Key trends
- 7.2 2D
- 7.3 3D
Chapter 8 Market Estimates & Forecast, By Price, 2021 - 2034 ($Bn
- 8.1 Key trends
- 8.2 Low
- 8.3 Medium
- 8.4 High
Chapter 9 Market Estimates & Forecast, By Application, 2021 - 2034 ($Bn)
- 9.1 Key trends
- 9.2 Restaurant parking lots
- 9.3 Theater parking lots
Chapter 10 Market Estimates & Forecast, By Region, 2021 - 2034 ($Bn)
- 10.1 Key trends
- 10.2 North America
- 10.2.1 The U.S.
- 10.2.2 Canada
- 10.3 Europe
- 10.3.1 UK
- 10.3.2 Germany
- 10.3.3 France
- 10.3.4 Italy
- 10.3.5 Spain
- 10.3.6 Russia
- 10.3.7 Nordics
- 10.4 Asia Pacific
- 10.4.1 China
- 10.4.2 India
- 10.4.3 Japan
- 10.4.4 Australia
- 10.4.5 South Korea
- 10.4.6 Southeast Asia
- 10.5 Latin America
- 10.5.1 Brazil
- 10.5.2 Mexico
- 10.5.3 Argentina
- 10.6 MAMEA
- 10.6.1 UAE
- 10.6.2 South Africa
- 10.6.3 Saudi Arabia
Chapter 11 Company Profiles
- 11.1 Capri Drive-In
- 11.2 Coyote Drive-In and Canteen
- 11.3 Delsea Drive-In
- 11.4 Field of Dreams Drive-In
- 11.5 Galaxy Drive-In
- 11.6 Hull's Drive-In
- 11.7 Malco Theatres
- 11.8 Mesa Drive-In
- 11.9 Shankweiler's Drive-In
- 11.10 South Bay Drive-In
- 11.11 Star Drive-In
- 11.12 Starlight Cinemas
- 11.13 Sunset Cinema Club
- 11.14 Van Buren Drive-In
- 11.15 Wellfleet Drive-In
 全球影院市场规模、份额、趋势和成长分析报告(2026-2034)电影院市场规模、占有率、成长及全球产业分析:依类型、应用和地区划分的洞察,以及2024-2032年预测
 全球音乐厅及剧院市场全球电影市场全球汽车电影院市场
 2025-2029年全球电影市场
 电影院市场规模、份额和成长分析(按类型、剧院类型、萤幕尺寸、萤幕类型、应用程式和地区)- 2025-2032 年产业预测
 电影院市场机会、成长动力、产业趋势分析与 2025 - 2034 年预测
 电影院市场报告:2030 年趋势、预测与竞争分析电影院市场:按类型、萤幕类型、票价、地区、范围和预测,2024-2031 年