


 |
市场调查报告书
商品编码
1699252
全像显示器市场机会、成长动力、产业趋势分析及 2025-2034 年预测Holographic Display Market Opportunity, Growth Drivers, Industry Trend Analysis, and Forecast 2025-2034 |
||||||
2024 年全球全像显示市场价值为 34 亿美元,预计 2025 年至 2034 年期间的复合年增长率将达到 25.2%。娱乐、医疗保健、汽车和教育等行业对 3D 视觉化的需求不断增长,推动市场成长。这些显示器透过沉浸式视觉效果增强了使用者体验,无需额外的配件。高解析度成像和人工智慧驱动的内容等技术进步正在进一步加速其应用。对下一代全息投影系统和互动式 AR/VR 相容平台的投资正在扩大游戏、现场活动和数位广告中的应用。此外,对非接触式控制、即时 3D 渲染和增强互动功能的需求正在推动市场扩张。医学影像、汽车平视显示器和工程视觉化领域对这些显示器的日益青睐正在创造巨大的机会。随着各行各业寻求更先进、更具互动性的显示解决方案,全像技术正在成为下一代数位体验的重要组成部分。
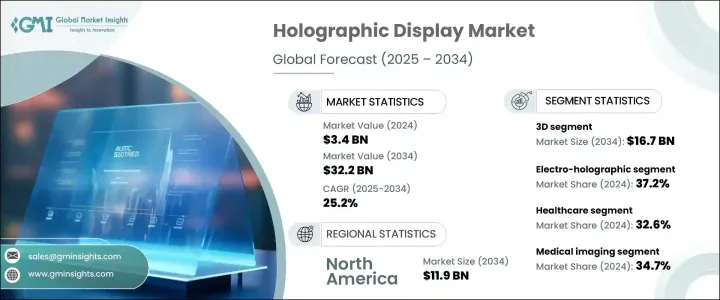
从维度来看,市场分为2D、3D、4D。随着各行各业越来越多地采用沉浸式显示技术进行互动,预计到 2034 年 3D 领域将创造 167 亿美元的收入。 3D 全像显示器能够提供多角度视图和即时处理数位内容,这推动了其需求,尤其是在零售、医疗保健和游戏领域。
| 市场范围 | |
|---|---|
| 起始年份 | 2024 |
| 预测年份 | 2025-2034 |
| 起始值 | 34亿美元 |
| 预测值 | 322亿美元 |
| 复合年增长率 | 25.2% |
根据技术,市场分为电子全像、触控、雷射和活塞。 2024 年,电子全像技术占据了 37.2% 的市场。该技术因其无需实体萤幕即可产生高解析度 3D 影像的能力而越来越受欢迎,使其适用于医疗保健和汽车等多个行业的应用。
就产业垂直而言,市场分为零售、消费性电子、医疗保健、娱乐和媒体以及航太和国防。医疗保健产业引领市场,2024 年的收入份额为 32.6%。全像显示器越来越多地应用于医疗程序,协助外科医生进行术前和术中规划。这些显示器提供器官、血管和肿瘤的详细 3D 视觉化,提高手术精确度和患者治疗效果。由于它们能够增强深度感知并降低手术风险,因此它们在神经外科、骨科手术和心血管手术中的应用正在扩大。
根据应用,市场分为相机、数位看板、医学影像、 CT 和 MRI、智慧电视、笔记型电脑等。医学影像成为主导应用,到 2024 年占据了 34.7% 的市场。全像显示器增强了 CT 和 MRI 扫描,提供更清晰的 3D 视图,有助于诊断和治疗计划。随着医疗保健提供者寻求提高患者护理的准确性,对高精度成像解决方案的需求正在上升。
从地区来看,预计到 2034 年北美的市场规模将达到 119 亿美元,这得益于汽车、航太和娱乐产业应用的不断增加。 2024 年,美国市场规模将超过 9 亿美元,消费性电子产品、AR/VR 应用和数位广告的投资不断成长,推动了全像显示技术的进步。
目录
第一章:方法论与范围
第二章:执行摘要
第三章:行业洞察
- 产业生态系统分析
- 产业衝击力
- 成长动力
- 3D全像显示器需求不断成长
- 扩增实境 (AR) 和虚拟实境 (VR) 的采用率不断提高
- 医疗领域对医学影像的应用日益广泛
- 全像展示在游戏和娱乐领域越来越受欢迎
- 全像显示器在数位看板和零售领域的应用日益增多
- 产业陷阱与挑战
- 生产和实施成本高
- 有限的内容和软体相容性
- 成长动力
- 成长潜力分析
- 监管格局
- 技术格局
- 未来市场趋势
- 波特的分析
- PESTEL分析
第四章:竞争格局
- 介绍
- 公司市占率分析
- 主要市场参与者的竞争分析
- 竞争定位矩阵
- 策略仪表板
第五章:市场估计与预测:按技术,2021 年至 2034 年
- 主要趋势
- 电子全息
- 可触摸
- 雷射
- 活塞
第六章:市场估计与预测:依维度,2021 年至 2034 年
- 主要趋势
- 2D
- 3D
- 4D
第七章:市场估计与预测:按应用,2021 年至 2034 年
- 主要趋势
- 相机
- 数位看板
- 医学影像
- 智慧电视
- 笔记型电脑
- 其他的
第八章:市场估计与预测:按产业垂直,2021 年至 2034 年
- 主要趋势
- 消费性电子产品
- 零售
- 卫生保健
- 娱乐和媒体
- 航太和国防
- 其他的
第九章:市场估计与预测:按地区,2021 年至 2034 年
- 主要趋势
- 北美洲
- 我们
- 加拿大
- 欧洲
- 德国
- 英国
- 法国
- 西班牙
- 义大利
- 荷兰
- 亚太地区
- 中国
- 印度
- 日本
- 澳洲
- 韩国
- 拉丁美洲
- 巴西
- 墨西哥
- 阿根廷
- 中东和非洲
- 沙乌地阿拉伯
- 南非
- 阿联酋
第十章:公司简介
- EON Reality
- HoloTech Switzerland AG
- HYPERVSN
- Leia Display System
- Light Field Lab, Inc.
- Looking Glass
- MDH Hologram
- Musion IP Limited
- Nanjing DSeeLab Digital Technology Co.,Ltd.
- Realfiction
- REALFICTION
- RealView Imaging Ltd.
- SeeReal Technologies GmBH
- VividQ
- Voxon Photonics
The Global Holographic Display Market, valued at USD 3.4 billion in 2024, is set to expand at a 25.2% CAGR from 2025 to 2034. The increasing demand for 3D visualization in industries such as entertainment, healthcare, automotive, and education is fueling market growth. These displays enhance user experiences with immersive visuals, eliminating the need for additional accessories. Technological advancements, including high-resolution imaging and AI-driven content, are further accelerating adoption. Investments in next-generation holographic projection systems and interactive AR/VR-compatible platforms are expanding applications in gaming, live events, and digital advertising. Additionally, the demand for touchless controls, real-time 3D rendering, and enhanced interactive features is driving market expansion. The growing preference for these displays in medical imaging, automotive heads-up displays, and engineering visualization is creating significant opportunities. As industries seek more advanced and interactive display solutions, holographic technology is becoming a vital component of next-generation digital experiences.
By dimension, the market is divided into 2D, 3D, and 4D. The 3D segment is expected to generate USD 16.7 billion by 2034 as industries increasingly adopt immersive display technologies for interactive engagement. The ability of 3D holographic displays to offer multi-angle views and real-time manipulation of digital content is driving their demand, particularly in retail, healthcare, and gaming.
| Market Scope | |
|---|---|
| Start Year | 2024 |
| Forecast Year | 2025-2034 |
| Start Value | $3.4 Billion |
| Forecast Value | $32.2 Billion |
| CAGR | 25.2% |
Based on technology, the market is segmented into electro-holographic, touchable, laser, and piston. The electro-holographic segment accounted for 37.2% of the market share in 2024. This technology is gaining popularity due to its ability to produce high-resolution 3D images without requiring physical screens, making it suitable for applications in multiple industries, including healthcare and automotive.
In terms of industry verticals, the market is classified into retail, consumer electronics, healthcare, entertainment and media, and aerospace and defense. The healthcare sector led the market, holding a 32.6% revenue share in 2024. Holographic displays are increasingly used in medical procedures, assisting surgeons in preoperative and intraoperative planning. These displays provide detailed 3D visualizations of organs, blood vessels, and tumors, improving surgical precision and patient outcomes. Their application in neurosurgery, orthopedic procedures, and cardiovascular surgeries is expanding due to their ability to enhance depth perception and reduce surgical risks.
By application, the market is segmented into cameras, digital signage, medical imaging, CT & MRI, smart TVs, laptops, and others. Medical imaging emerged as the dominant application, securing a 34.7% market share in 2024. Holographic displays enhance CT and MRI scans, offering clearer 3D views that aid in diagnostics and treatment planning. The demand for high-precision imaging solutions is rising as healthcare providers seek improved accuracy in patient care.
Regionally, North America is projected to reach USD 11.9 billion by 2034, driven by increased adoption across automotive, aerospace, and entertainment industries. The U.S. market surpassed USD 900 million in 2024, with growing investments in consumer electronics, AR/VR applications, and digital advertising fueling advancements in holographic display technology.
Table of Contents
Chapter 1 Methodology and Scope
- 1.1 Market scope and definitions
- 1.2 Research design
- 1.2.1 Research approach
- 1.2.2 Data collection methods
- 1.3 Base estimates and calculations
- 1.3.1 Base year calculation
- 1.3.2 Key trends for market estimation
- 1.4 Forecast model
- 1.5 Primary research and validation
- 1.5.1 Primary sources
- 1.5.2 Data mining sources
Chapter 2 Executive Summary
- 2.1 Industry 360° synopsis
Chapter 3 Industry Insights
- 3.1 Industry ecosystem analysis
- 3.2 Industry impact forces
- 3.2.1 Growth drivers
- 3.2.1.1 Rising demand for 3D holographic displays
- 3.2.1.2 Increasing adoption in augmented reality (AR) and virtual reality (VR)
- 3.2.1.3 Growing adoption in healthcare for medical imaging
- 3.2.1.4 Growing popularity of holographic displays in gaming and entertainment
- 3.2.1.5 Rising adoption of holographic displays in digital signage and retail
- 3.2.2 Industry pitfalls and challenges
- 3.2.2.1 High production and implementation costs
- 3.2.2.2 Limited content and software compatibility
- 3.2.1 Growth drivers
- 3.3 Growth potential analysis
- 3.4 Regulatory landscape
- 3.5 Technology landscape
- 3.6 Future market trends
- 3.7 Porter's analysis
- 3.8 PESTEL analysis
Chapter 4 Competitive Landscape, 2024
- 4.1 Introduction
- 4.2 Company market share analysis
- 4.3 Competitive analysis of major market players
- 4.4 Competitive positioning matrix
- 4.5 Strategy dashboard
Chapter 5 Market Estimates and Forecast, By Technology, 2021 – 2034 (USD Bn)
- 5.1 Key trends
- 5.2 Electro-holographic
- 5.3 Touchable
- 5.4 Laser
- 5.5 Piston
Chapter 6 Market Estimates and Forecast, By Dimension, 2021 – 2034 (USD Bn)
- 6.1 Key trends
- 6.2 2D
- 6.3 3D
- 6.4 4D
Chapter 7 Market Estimates and Forecast, By Application, 2021 – 2034 (USD Bn)
- 7.1 Key trends
- 7.2 Camera
- 7.3 Digital signage
- 7.4 Medical imaging
- 7.5 Smart TV
- 7.6 Laptops
- 7.7 Others
Chapter 8 Market Estimates and Forecast, By Industry Vertical, 2021 – 2034 (USD Bn)
- 8.1 Key trends
- 8.2 Consumer electronics
- 8.3 Retail
- 8.4 Healthcare
- 8.5 Entertainment and media
- 8.6 Aerospace and defense
- 8.7 Others
Chapter 9 Market Estimates and Forecast, By Region, 2021 – 2034 (USD Bn)
- 9.1 Key trends
- 9.2 North America
- 9.2.1 U.S.
- 9.2.2 Canada
- 9.3 Europe
- 9.3.1 Germany
- 9.3.2 UK
- 9.3.3 France
- 9.3.4 Spain
- 9.3.5 Italy
- 9.3.6 Netherlands
- 9.4 Asia Pacific
- 9.4.1 China
- 9.4.2 India
- 9.4.3 Japan
- 9.4.4 Australia
- 9.4.5 South Korea
- 9.5 Latin America
- 9.5.1 Brazil
- 9.5.2 Mexico
- 9.5.3 Argentina
- 9.6 Middle East and Africa
- 9.6.1 Saudi Arabia
- 9.6.2 South Africa
- 9.6.3 UAE
Chapter 10 Company Profiles
- 10.1 EON Reality
- 10.2 HoloTech Switzerland AG
- 10.3 HYPERVSN
- 10.4 Leia Display System
- 10.5 Light Field Lab, Inc.
- 10.6 Looking Glass
- 10.7 MDH Hologram
- 10.8 Musion IP Limited
- 10.9 Nanjing DSeeLab Digital Technology Co.,Ltd.
- 10.10 Realfiction
- 10.11 REALFICTION
- 10.12 RealView Imaging Ltd.
- 10.13 SeeReal Technologies GmBH
- 10.14 VividQ
- 10.15 Voxon Photonics
 2026年全像显示器市场报告
 全像显示器市场规模、份额和成长分析(按组件、产品、技术、尺寸、应用和地区划分)—2026-2033年产业预测
 全像显示器市场-全球产业规模、份额、趋势、机会和预测,按产品类型、技术、最终用户、地区和竞争格局划分,2020-2030年预测
 全像显示市场报告(按组件、技术、尺寸、应用、最终用户和地区)2025-2033
 全像显示市场(按显示类型、图像尺寸、技术和应用)—2025-2032 年全球预测
 全像显示市场(按技术和地区)
 全像显示器市场:产业趋势及全球预测(~2035年):依产品类型、应用、技术类型、公司类型及主要地区
 全像显示器:市场占有率分析、产业趋势、统计数据和成长预测(2025-2030 年)
 2025-2029年全像显示器市场
 到 2030 年全像市场预测:按产品类型、组件、技术、尺寸、最终用户和地区进行的全球分析