


 |
市场调查报告书
商品编码
1699338
电动车 (EV) 充电线市场机会、成长动力、产业趋势分析及 2025-2034 年预测Electric Vehicle (EV) Charging Cable Market Opportunity, Growth Drivers, Industry Trend Analysis, and Forecast 2025-2034 |
||||||
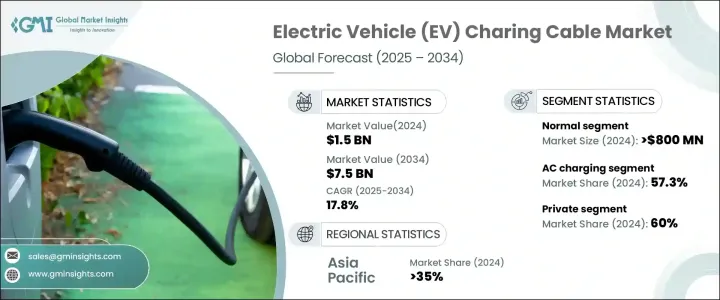
2024 年全球电动车充电线市场价值为 15 亿美元,预计 2025 年至 2034 年期间的复合年增长率为 17.8%。在消费者日益普及和政府大力支持的推动下,电动车产业的快速扩张正在推动对可靠充电基础设施的需求。随着世界各国推动更环保的交通解决方案,对高品质充电线的需求变得比以往任何时候都更加迫切。
汽车製造商正在增加电动车的产量,因此对支援各种充电速度和车型的高效充电解决方案的需求也随之增加。政府和私营部门参与者正在大力投资扩大公共和私人充电网络,进一步扩大对电动车充电电缆的需求。随着电池技术的进步和向快速充电功能的转变,业界对高功率和液冷电缆的偏好日益增长。电缆材料的创新、耐用性和增强的安全性能也在推动其应用,使充电电缆成为未来永续交通的关键组成部分。
| 市场范围 | |
|---|---|
| 起始年份 | 2024 |
| 预测年份 | 2025-2034 |
| 起始值 | 15亿美元 |
| 预测值 | 75亿美元 |
| 复合年增长率 | 17.8% |
电动车充电电缆市场分为一般电缆、高功率电缆和液冷大功率电缆。 2024 年,普通电缆部分将引领市场,创造 8 亿美元的收入。这种主导地位可以归因于这些电缆的价格低廉且易于製造,使其成为汽车製造商和消费者的首选。同时,高功率电缆正成为成长最快的领域,预计2025年至2034年的复合年增长率约为19%。这些电缆对于支援超快速充电站越来越重要,使电动车能够在更短的时间内充电并提高用户的便利性。
2024 年,亚太地区占电动车充电电缆市场的 35%,其中中国以 2.499 亿美元的收入领先该地区。在政府优惠政策和大力投资充电基础设施的支持下,中国大力推动电动车的发展,巩固了其作为关键市场驱动力的地位。作为全球最大的电动车市场,中国不断在充电技术方面树立标桿,影响全球充电电缆需求的趋势。该国广泛的电动车普及率和快速的基础设施发展凸显了充电电缆在实现向电动交通的广泛过渡中的关键作用。
目录
第一章:方法论与范围
- 研究设计
- 研究方法
- 资料收集方法
- 基础估算与计算
- 基准年计算
- 市场评估的主要趋势
- 预测模型
- 初步研究和验证
- 主要来源
- 资料探勘来源
- 市场范围和定义
第二章:执行摘要
第三章:行业洞察
- 产业生态系统分析
- 原物料供应商
- 零件供应商
- 製造商
- 技术提供者
- 最终用途
- 供应商格局
- 利润率分析
- 技术与创新格局
- 专利分析
- 重要新闻和倡议
- 监管格局
- 价格趋势
- 成本細項分析
- 衝击力
- 成长动力
- 电动车的兴起
- 政府支持
- 对快速充电解决方案的需求
- 产业陷阱与挑战
- 基础设施成本高
- 市场竞争与定价
- 成长动力
- 成长潜力分析
- 波特的分析
- PESTEL分析
第四章:竞争格局
- 介绍
- 公司市占率分析
- 竞争定位矩阵
- 战略展望矩阵
第五章:市场估计与预测:按电缆,2021 - 2034 年
- 主要趋势
- 普通的
- 高功率
- 液冷大功率
第六章:市场估计与预测:按功率,2021 - 2034 年
- 主要趋势
- 交流充电
- 直流充电
第七章:市场估计与预测:依电缆长度,2021 - 2034 年
- 主要趋势
- 5米以下
- 6-10米
- 10公尺以上
第八章:市场估计与预测:按形状,2021 - 2034 年
- 主要趋势
- 直的
- 盘绕
第九章:市场估计与预测:按收费水平,2021 - 2034 年
- 主要趋势
- 1级
- 2级
- 3级
第 10 章:市场估计与预测:按应用,2021 年至 2034 年
- 主要趋势
- 民众
- 私人的
第 11 章:市场估计与预测:按夹克材料,2021 年至 2034 年
- 主要趋势
- 全橡胶
- 热塑性弹性体 (TPE)
- 聚氯乙烯(PVC)
第 12 章:市场估计与预测:按连接器,2021 年至 2034 年
- 主要趋势
- 类型 1
- 类型 2
- CCS1
- CCS2
- 查德莫
- 国标/T
- NACS/TESLA连接器
第 13 章:市场估计与预测:按直径,2021 年至 2034 年
- 主要趋势
- 10毫米
- 10-20毫米
- >20毫米
第 14 章:市场估计与预测:按模式,2021 年至 2034 年
- 主要趋势
- 模式 1 和 2
- 模式 3
- 模式 4
第 15 章:市场估计与预测:按地区,2021 年至 2034 年
- 主要趋势
- 北美洲
- 我们
- 加拿大
- 欧洲
- 英国
- 德国
- 法国
- 义大利
- 西班牙
- 俄罗斯
- 北欧人
- 亚太地区
- 中国
- 印度
- 日本
- 澳洲
- 韩国
- 东南亚
- 拉丁美洲
- 巴西
- 墨西哥
- 阿根廷
- MEA
- 阿联酋
- 南非
- 沙乌地阿拉伯
第 16 章:公司简介
- AG Electrical
- Aptiv
- Besen International
- Brugg eConnect
- Chengdu Khons
- Coroplast
- Dyden
- Eland Cable
- EV Cable
- General Cable Technologies
- Guangdong OMG
- HUBER+SUHNER
- Leoni AG
- Mennekes Elektrotechnik
- Phoenix Contact
- Sinbon Electronics
- Suzlon Cable
- Systems Wire Cables
- TE Connectivity
- Teison Energy Technology
The Global Electric Vehicle Charging Cable Market was valued at USD 1.5 billion in 2024 and is projected to grow at a CAGR of 17.8% between 2025 and 2034. The rapid expansion of the electric vehicle sector, driven by increasing consumer adoption and strong governmental support, is fueling the demand for reliable charging infrastructure. As nations worldwide push for greener transportation solutions, the need for high-quality charging cables is becoming more critical than ever.
Automakers are ramping up EV production, leading to a greater need for efficient charging solutions that support various charging speeds and vehicle types. Governments and private sector players are making significant investments in expanding public and private charging networks, further amplifying demand for EV charging cables. With advancements in battery technology and the shift toward fast-charging capabilities, the industry is witnessing a growing preference for high-power and liquid-cooled cables. Innovations in cable materials, improved durability, and enhanced safety features are also driving adoption, making charging cables a crucial component in the future of sustainable transportation.
| Market Scope | |
|---|---|
| Start Year | 2024 |
| Forecast Year | 2025-2034 |
| Start Value | $1.5 Billion |
| Forecast Value | $7.5 Billion |
| CAGR | 17.8% |
The electric vehicle charging cable market is categorized into normal, high-power, and liquid-cooled high-power cables. In 2024, the normal cable segment led the market, generating USD 800 million in revenue. This dominance can be attributed to the affordability and ease of manufacturing associated with these cables, making them a preferred choice for both automakers and consumers. Meanwhile, high-power cables are emerging as the fastest-growing segment, with a projected CAGR of approximately 19% from 2025 to 2034. These cables are increasingly essential in supporting ultra-fast charging stations, enabling EVs to recharge in significantly less time and improving user convenience.
Asia-Pacific held a 35% share of the EV charging cable market in 2024, with China leading the region by generating USD 249.9 million in revenue. The country's robust push for electric mobility, supported by favorable government policies and aggressive investments in charging infrastructure, has solidified its position as a key market driver. As the largest EV market in the world, China continues to set benchmarks in charging technology, influencing global trends in charging cable demand. The country's extensive EV adoption rates and rapid infrastructure development highlight the critical role of charging cables in enabling the widespread transition to electric transportation.
Table of Contents
Chapter 1 Methodology & Scope
- 1.1 Research design
- 1.1.1 Research approach
- 1.1.2 Data collection methods
- 1.2 Base estimates & calculations
- 1.2.1 Base year calculation
- 1.2.2 Key trends for market estimation
- 1.3 Forecast model
- 1.4 Primary research and validation
- 1.4.1 Primary sources
- 1.4.2 Data mining sources
- 1.5 Market scope & definition
Chapter 2 Executive Summary
- 2.1 Industry synopsis, 2021 - 2034
Chapter 3 Industry Insights
- 3.1 Industry ecosystem analysis
- 3.1.1 Raw material suppliers
- 3.1.2 Component suppliers
- 3.1.3 Manufacturers
- 3.1.4 Technology providers
- 3.1.5 End use
- 3.2 Supplier landscape
- 3.3 Profit margin analysis
- 3.4 Technology & innovation landscape
- 3.5 Patent analysis
- 3.6 Key news & initiatives
- 3.7 Regulatory landscape
- 3.8 Price trends
- 3.9 Cost breakdown analysis
- 3.10 Impact forces
- 3.10.1 Growth drivers
- 3.10.1.1 Rise of EVs
- 3.10.1.2 Government support
- 3.10.1.3 Demand for fast charging solutions
- 3.10.2 Industry pitfalls & challenges
- 3.10.2.1 High infrastructure costs
- 3.10.2.2 Market competition and pricing
- 3.10.1 Growth drivers
- 3.11 Growth potential analysis
- 3.12 Porter's analysis
- 3.13 PESTEL analysis
Chapter 4 Competitive Landscape, 2024
- 4.1 Introduction
- 4.2 Company market share analysis
- 4.3 Competitive positioning matrix
- 4.4 Strategic outlook matrix
Chapter 5 Market Estimates & Forecast, By Cable, 2021 - 2034 ($Bn, Units)
- 5.1 Key trends
- 5.2 Normal
- 5.3 High power
- 5.4 Liquid-cooled high power
Chapter 6 Market Estimates & Forecast, By Power, 2021 - 2034 ($Bn, Units)
- 6.1 Key trends
- 6.2 AC charging
- 6.3 DC charging
Chapter 7 Market Estimates & Forecast, By Cable Length, 2021 - 2034 ($Bn, Units)
- 7.1 Key trends
- 7.2 Below 5 meters
- 7.3 6-10 meters
- 7.4 Above 10 meters
Chapter 8 Market Estimates & Forecast, By Shape, 2021 - 2034 ($Bn, Units)
- 8.1 Key trends
- 8.2 Straight
- 8.3 Coiled
Chapter 9 Market Estimates & Forecast, By Charging Level, 2021 - 2034 ($Bn, Units)
- 9.1 Key trends
- 9.2 Level 1
- 9.3 Level 2
- 9.4 Level 3
Chapter 10 Market Estimates & Forecast, By Application, 2021 - 2034 ($Bn, Units)
- 10.1 Key trends
- 10.2 Public
- 10.3 Private
Chapter 11 Market Estimates & Forecast, By Jacket Material, 2021 - 2034 ($Bn, Units)
- 11.1 Key trends
- 11.2 All rubber
- 11.3 Thermoplastic Elastomer (TPE)
- 11.4 Polyvinyle Chlroide (PVC)
Chapter 12 Market Estimates & Forecast, By Connector, 2021 - 2034 ($Bn, Units)
- 12.1 Key trends
- 12.2 Type 1
- 12.3 Type 2
- 12.4 CCS1
- 12.5 CCS2
- 12.6 CHAdeMO
- 12.7 GB/T
- 12.8 NACS/TESLA Connectors
Chapter 13 Market Estimates & Forecast, By Diameter, 2021 - 2034 ($Bn, Units)
- 13.1 Key trends
- 13.2 10 mm
- 13.3 10-20 mm
- 13.4 >20mm
Chapter 14 Market Estimates & Forecast, By Mode, 2021 - 2034 ($Bn, Units)
- 14.1 Key trends
- 14.2 Mode 1 & 2
- 14.3 Mode 3
- 14.4 Mode 4
Chapter 15 Market Estimates & Forecast, By Region, 2021 - 2034 ($Bn, Units)
- 15.1 Key trends
- 15.2 North America
- 15.2.1 U.S.
- 15.2.2 Canada
- 15.3 Europe
- 15.3.1 UK
- 15.3.2 Germany
- 15.3.3 France
- 15.3.4 Italy
- 15.3.5 Spain
- 15.3.6 Russia
- 15.3.7 Nordics
- 15.4 Asia Pacific
- 15.4.1 China
- 15.4.2 India
- 15.4.3 Japan
- 15.4.4 Australia
- 15.4.5 South Korea
- 15.4.6 Southeast Asia
- 15.5 Latin America
- 15.5.1 Brazil
- 15.5.2 Mexico
- 15.5.3 Argentina
- 15.6 MEA
- 15.6.1 UAE
- 15.6.2 South Africa
- 15.6.3 Saudi Arabia
Chapter 16 Company Profiles
- 16.1 AG Electrical
- 16.2 Aptiv
- 16.3 Besen International
- 16.4 Brugg eConnect
- 16.5 Chengdu Khons
- 16.6 Coroplast
- 16.7 Dyden
- 16.8 Eland Cable
- 16.9 EV Cable
- 16.10 General Cable Technologies
- 16.11 Guangdong OMG
- 16.12 HUBER+SUHNER
- 16.13 Leoni AG
- 16.14 Mennekes Elektrotechnik
- 16.15 Phoenix Contact
- 16.16 Sinbon Electronics
- 16.17 Suzlon Cable
- 16.18 Systems Wire Cables
- 16.19 TE Connectivity
- 16.20 Teison Energy Technology
 全球液冷式电动车充电电缆市场:按电缆能量、电缆长度、电缆直径、应用、覆材、冷却剂和地区分類的2032年预测
 2026年全球USB-C充电线市场报告
 电动车充电线市场 - 全球产业规模、份额、趋势、机会、预测:按应用、长度、充电等级、电源、地区和竞争格局划分,2021-2031年
 电动车充电线市场规模、份额及成长分析(按线缆类型、充电线、连接器类型、直径、材质、长度及地区划分)-产业预测(2026-2033年)
 液冷式电动车充电线缆市场机会、成长驱动因素、产业趋势分析及预测(2025-2034年)
 电动车充电线市场按材质、相数、充电模式、车辆类型、最终用户、连接器类型、额定电流和电缆长度划分-2025-2032年全球预测2025年全球电动车(EV)充电线市场报告
 全球电动汽车电缆市场全球电动车充电电缆市场
 2025-2033 年日本电动车充电电缆市场报告(按电缆长度、形状、充电水平、功率类型、应用和地区)