


 |
市场调查报告书
商品编码
1699361
互动式平板显示器市场机会、成长动力、产业趋势分析及 2025-2034 年预测Interactive Flat Panel Display Market Opportunity, Growth Drivers, Industry Trend Analysis, and Forecast 2025-2034 |
||||||
2024 年全球互动式平板显示器市场价值为 126 亿美元,预计 2025 年至 2034 年的复合年增长率为 7.5%。互动式显示器在多个行业的快速应用推动了这一扩张,尤其是在教育、企业环境和零售领域。随着数位转型的加速,企业和机构认识到互动式平板显示器在增强沟通、参与和协作方面的价值。智慧教室的推动以及政府整合先进学习工具的措施进一步推动了市场成长。这些显示器有利于即时资讯共享和沈浸式学习,从而带来丰富的教育体验。随着各机构寻求传统教学方法的有效数位化替代方案,远距和混合学习模式的兴起也促进了采用率的提高。同样,企业正在利用这些显示器进行互动式演示、资料视觉化和无缝远端协作,从而推动全球需求。
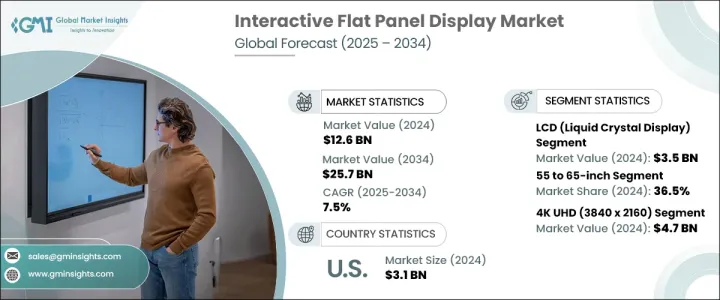
技术进步在市场扩张中发挥着至关重要的作用。市场细分为 LED(发光二极体)、LCD(液晶显示器)、OLED(有机发光二极体)、电子纸和 DLP(数位光处理)。受零售、医疗保健和汽车等行业对高清显示器需求不断增长的推动,LCD 市场的规模到 2024 年将达到 35 亿美元。智慧型手机、平板电脑和智慧电视等消费性电子产品严重依赖 LCD 技术,因为它具有卓越的解析度、紧凑的设计和能源效率。色彩精度、对比度和刷新率的进步提高了显示质量,使 LCD 成为高端应用的首选。
| 市场范围 | |
|---|---|
| 起始年份 | 2024 |
| 预测年份 | 2025-2034 |
| 起始值 | 126亿美元 |
| 预测值 | 257亿美元 |
| 复合年增长率 | 7.5% |
萤幕尺寸在消费者的购买决策中扮演重要角色。市场分为 55 吋以下、55 至 65 吋、65 至 75 吋和 75 吋以上。预计到 2024 年,55 至 65 吋电视将占据 36.5% 的市场份额,这得益于其在家庭娱乐和企业会议空间中的普及。随着消费者寻求高品质的视觉效果和身临其境的体验,而又不想承担更大显示器的成本负担,对中型家庭剧院系统的需求正在上升。家庭媒体室、游戏设定和智慧家庭整合正在推动这些显示器的采用,使其成为个人和专业应用的首选。
2024 年北美互动式平板显示器市场价值为 31 亿美元,其中美国引领区域成长。汽车、医疗保健和企业等领域越来越多地采用互动式萤幕,这推动了需求。企业正在整合这些显示器,以实现高效的协作、资料共享和增强的客户互动。智慧办公室和数位化工作场所的不断发展正在进一步扩大市场。触控萤幕创新、4K 和 8K 解析度以及人工智慧功能等技术进步使美国成为全球市场的主导力量。随着对智慧互动解决方案的需求不断增长,该行业不断发展,为各种应用提供更先进、更用户友好的显示器。
目录
第一章:方法论与范围
- 市场范围和定义
- 基础估算与计算
- 预测计算
- 资料来源
- 基本的
- 次要
- 付费来源
- 公共资源
第二章:执行摘要
第三章:行业洞察
- 产业生态系统分析
- 影响价值链的因素
- 利润率分析
- 中断
- 未来展望
- 製造商
- 经销商
- 供应商格局
- 利润率分析
- 重要新闻和倡议
- 监管格局
- 衝击力
- 成长动力
- 互动式平板显示器在教育领域的新兴应用
- 政府对互动式平板显示器的支援不断增加
- 游戏和娱乐产业对互动式平板显示器的采用激增
- 互动式平板显示器在汽车领域的应用日益广泛
- 科技快速发展
- 产业陷阱与挑战
- 互动组件、显示面板等零件成本高
- 对安全的担忧日益加剧
- 成长动力
- 成长潜力分析
- 波特的分析
- PESTEL分析
第四章:竞争格局
- 介绍
- 公司市占率分析
- 竞争定位矩阵
- 战略展望矩阵
第五章:市场估计与预测:依萤幕尺寸,2021-2034
- 主要趋势
- 55吋以下
- 55至65英寸
- 65 至 75 英寸
- 75吋以上
第六章:市场估计与预测:依技术,2021-2034 年
- 主要趋势
- LCD(液晶显示器)
- LED(发光二极体)
- OLED(有机发光二极体)
- DLP(数位光处理)
- 电子纸
第七章:市场估计与预测:依决议,2021-2034
- 主要趋势
- 高清(1280 x 720)
- 全高清 (1920 x 1080)
- 4K 超高清 (3840 x 2160)
- 8K 超高清 (7680 x 4320)
第八章:市场预估与预测:按面板类型,2021-2034
- 主要趋势
- 电阻式
- 电容式
- 红外线的
- 光学的
- 电磁
- 表面声波(SAW)
第九章:市场估计与预测:依连结性,2021-2034
- 主要趋势
- 有线
- 无线的
第十章:市场估计与预测:依互动技术,2021-2034 年
- 主要趋势
- 基于触摸
- 笔式
- 基于手势
第 11 章:市场估计与预测:按应用,2021 年至 2034 年
- 主要趋势
- 教育
- 公司的
- 卫生保健
- 零售
- 饭店业
- 其他的
第 12 章:市场估计与预测:按地区,2021 年至 2034 年
- 主要趋势
- 北美洲
- 我们
- 加拿大
- 欧洲
- 英国
- 德国
- 法国
- 义大利
- 西班牙
- 俄罗斯
- 亚太地区
- 中国
- 印度
- 日本
- 韩国
- 澳洲
- 拉丁美洲
- 巴西
- 墨西哥
- MEA
- 南非
- 沙乌地阿拉伯
- 阿联酋
第十三章:公司简介
- BenQ Corporation
- Boxlight Corporation
- Casio Computer Co., Ltd.
- Clevertouch Technologies
- Dell Technologies Inc.
- Epson America, Inc.
- Gaoke
- Genee World
- Hisense Group
- Hitachi Ltd.
- LG Electronics Inc.
- Microsoft Corporation
- NEC Display Solutions
- Newline Interactive Inc.
- Optoma Corporation
- Panasonic Corporation
- Philips
- Promethean Limited
- Ricoh Company, Ltd.
- Samsung Electronics Co., Ltd.
- Sharp Corporation
- Sony Corporation
- TouchIT Technologies
- Vestel Group
- ViewSonic Corporation
The Global Interactive Flat Panel Display Market was valued at USD 12.6 billion in 2024 and is projected to grow at a CAGR of 7.5% from 2025 to 2034. The rapid adoption of interactive displays across multiple industries is fueling this expansion, particularly in education, corporate environments, and the retail sector. As digital transformation accelerates, businesses and institutions recognize the value of interactive flat panel displays in enhancing communication, engagement, and collaboration. The push for smart classrooms, alongside government initiatives to integrate advanced learning tools, is further propelling market growth. These displays facilitate real-time information sharing and immersive learning, fostering an enriched educational experience. The rise of remote and hybrid learning models is also contributing to increased adoption as institutions seek effective digital alternatives to traditional teaching methods. Similarly, businesses are leveraging these displays for interactive presentations, data visualization, and seamless remote collaboration, boosting demand globally.
Technology advancements are playing a crucial role in market expansion. The market is segmented into LED (Light Emitting Diode), LCD (Liquid Crystal Display), OLED (Organic Light Emitting Diode), E-Paper, and DLP (Digital Light Processing). The LCD segment accounted for USD 3.5 billion in 2024, driven by rising demand for high-definition displays across industries such as retail, healthcare, and automotive. Consumer electronics, including smartphones, tablets, and smart TVs, heavily rely on LCD technology due to its superior resolution, compact design, and energy efficiency. Advancements in color accuracy, contrast ratios, and refresh rates are enhancing display quality, making LCDs a preferred choice for high-end applications.
| Market Scope | |
|---|---|
| Start Year | 2024 |
| Forecast Year | 2025-2034 |
| Start Value | $12.6 Billion |
| Forecast Value | $25.7 Billion |
| CAGR | 7.5% |
Screen size plays a significant role in consumer purchasing decisions. The market is categorized into Below 55 Inches, 55 to 65 Inches, 65 to 75 Inches, and Above 75 Inches. The 55 to 65-inch segment is expected to hold a 36.5% market share in 2024, driven by its popularity in home entertainment and corporate meeting spaces. The demand for mid-sized home theater systems is rising as consumers seek high-quality visuals and immersive experiences without the cost burden of larger displays. Family media rooms, gaming setups, and smart home integrations are fueling the adoption of these displays, making them a preferred option for both personal and professional applications.
North America Interactive Flat Panel Display Market was valued at USD 3.1 billion in 2024, with the United States leading regional growth. The increasing implementation of interactive screens across sectors like automotive, healthcare, and corporate enterprises is driving demand. Businesses are integrating these displays for efficient collaboration, data sharing, and enhanced customer interactions. The ongoing development of smart offices and digital workplaces is further amplifying market expansion. Technological advancements, including touch-screen innovations, 4K and 8K resolutions, and AI-powered features, are positioning the United States as a dominant force in the global market. As demand for intelligent, interactive solutions rises, the industry continues to evolve, offering more advanced and user-friendly displays for diverse applications.
Table of Contents
Chapter 1 Methodology & Scope
- 1.1 Market scope & definitions
- 1.2 Base estimates & calculations
- 1.3 Forecast calculations
- 1.4 Data sources
- 1.4.1 Primary
- 1.4.2 Secondary
- 1.4.2.1 Paid sources
- 1.4.2.2 Public sources
Chapter 2 Executive Summary
- 2.1 Industry synopsis, 2021-2034
Chapter 3 Industry Insights
- 3.1 Industry ecosystem analysis
- 3.1.1 Factor affecting the value chain
- 3.1.2 Profit margin analysis
- 3.1.3 Disruptions
- 3.1.4 Future outlook
- 3.1.5 Manufacturers
- 3.1.6 Distributors
- 3.2 Supplier landscape
- 3.3 Profit margin analysis
- 3.4 Key news & initiatives
- 3.5 Regulatory landscape
- 3.6 Impact forces
- 3.6.1 Growth drivers
- 3.6.1.1 Emerging use of interactive flat panel display in education sector
- 3.6.1.2 Rising government support for interactive flat panel display
- 3.6.1.3 Surge in adoption of interactive flat panel display in gaming and entertainment industry
- 3.6.1.4 Increasing application of interactive flat panel display in automotives
- 3.6.1.5 Rapid technological developments
- 3.6.2 Industry pitfalls & challenges
- 3.6.2.1 High cost of interactive components, display panels, and other components
- 3.6.2.2 Growing concerns regarding security
- 3.6.1 Growth drivers
- 3.7 Growth potential analysis
- 3.8 Porter's analysis
- 3.9 PESTEL analysis
Chapter 4 Competitive Landscape, 2024
- 4.1 Introduction
- 4.2 Company market share analysis
- 4.3 Competitive positioning matrix
- 4.4 Strategic outlook matrix
Chapter 5 Market Estimates & Forecast, By Screen Size, 2021-2034 (USD Billion)
- 5.1 Key trends
- 5.2 Below 55 inches
- 5.3 55 to 65 inches
- 5.4 65 to 75 inches
- 5.5 Above 75 inches
Chapter 6 Market Estimates & Forecast, By Technology, 2021-2034 (USD Billion)
- 6.1 Key trends
- 6.2 LCD (Liquid Crystal Display)
- 6.3 LED (Light Emitting Diode)
- 6.4 OLED (Organic Light Emitting Diode)
- 6.5 DLP (Digital Light Processing)
- 6.6 E-Paper
Chapter 7 Market Estimates & Forecast, By Resolution, 2021-2034 (USD Billion)
- 7.1 Key trends
- 7.2 HD (1280 x 720)
- 7.3 Full HD (1920 x 1080)
- 7.4 4K UHD (3840 x 2160)
- 7.5 8K UHD (7680 x 4320)
Chapter 8 Market Estimates & Forecast, By Panel Type, 2021-2034 (USD Billion)
- 8.1 Key trends
- 8.2 Resistive
- 8.3 Capacitive
- 8.4 Infrared
- 8.5 Optical
- 8.6 Electromagnetic
- 8.7 Surface Acoustic Wave (SAW)
Chapter 9 Market Estimates & Forecast, By Connectivity, 2021-2034 (USD Billion)
- 9.1 Key trends
- 9.2 Wired
- 9.3 Wireless
Chapter 10 Market Estimates & Forecast, By Interactive Technology, 2021-2034 (USD Billion)
- 10.1 Key trends
- 10.2 Touch-based
- 10.3 Pen-based
- 10.4 Gesture-based
Chapter 11 Market Estimates & Forecast, By Application, 2021-2034 (USD Billion)
- 11.1 Key trends
- 11.2 Education
- 11.3 Corporate
- 11.4 Healthcare
- 11.5 Retail
- 11.6 Hospitality
- 11.7 Others
Chapter 12 Market Estimates & Forecast, By Region, 2021-2034 (USD Billion)
- 12.1 Key trends
- 12.2 North America
- 12.2.1 U.S.
- 12.2.2 Canada
- 12.3 Europe
- 12.3.1 UK
- 12.3.2 Germany
- 12.3.3 France
- 12.3.4 Italy
- 12.3.5 Spain
- 12.3.6 Russia
- 12.4 Asia Pacific
- 12.4.1 China
- 12.4.2 India
- 12.4.3 Japan
- 12.4.4 South Korea
- 12.4.5 Australia
- 12.5 Latin America
- 12.5.1 Brazil
- 12.5.2 Mexico
- 12.6 MEA
- 12.6.1 South Africa
- 12.6.2 Saudi Arabia
- 12.6.3 UAE
Chapter 13 Company Profiles
- 13.1 BenQ Corporation
- 13.2 Boxlight Corporation
- 13.3 Casio Computer Co., Ltd.
- 13.4 Clevertouch Technologies
- 13.5 Dell Technologies Inc.
- 13.6 Epson America, Inc.
- 13.7 Gaoke
- 13.8 Genee World
- 13.9 Hisense Group
- 13.10 Hitachi Ltd.
- 13.11 LG Electronics Inc.
- 13.12 Microsoft Corporation
- 13.13 NEC Display Solutions
- 13.14 Newline Interactive Inc.
- 13.15 Optoma Corporation
- 13.16 Panasonic Corporation
- 13.17 Philips
- 13.18 Promethean Limited
- 13.19 Ricoh Company, Ltd.
- 13.20 Samsung Electronics Co., Ltd.
- 13.21 Sharp Corporation
- 13.22 Sony Corporation
- 13.23 TouchIT Technologies
- 13.24 Vestel Group
- 13.25 ViewSonic Corporation
 全球海洋水族箱展示设备市场(依设备类型、价格范围、应用、最终用户和销售管道划分),2026-2032年预测
 平板显示器市场分析及预测(至2035年):依类型、产品类型、技术、组件、应用、材料类型、设备、最终用户、安装类型划分
 2026年全球平板显示器市场报告
 教育科技互动式平板显示器市场规模、份额及成长分析(按萤幕大小、技术、解析度、面板类型、连接方式、互动式技术和地区划分):产业预测(2026-2033 年)
 平板显示器市场规模、份额及成长分析(按技术、应用、产业及地区划分)-2026-2033年产业预测
 平板显示器市场:全球产业分析、市场规模、份额、成长、趋势与未来预测(2025-2032)
 2025-2029年全球平板显示设备市场
 平面显示器:季度市场追踪
 全球平面显示器玻璃基板市场
 2025 年至 2033 年平板显示器市场技术、应用、垂直产业和地区报告