


 |
市场调查报告书
商品编码
1699412
家用吸尘器市场机会、成长动力、产业趋势分析及2025-2034年预测Household Vacuum Cleaner Market Opportunity, Growth Drivers, Industry Trend Analysis, and Forecast 2025-2034 |
||||||
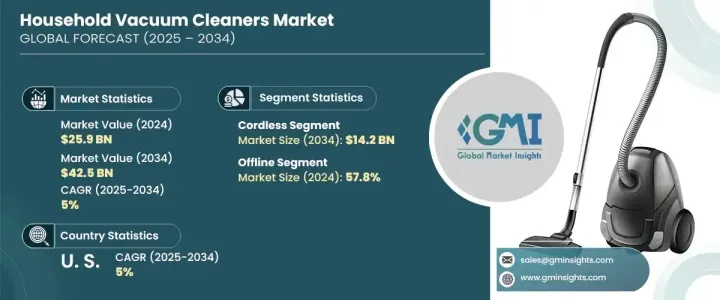
2024 年全球家用吸尘器市场价值为 259 亿美元,预计 2025 年至 2034 年期间的复合年增长率为 5%。卫生意识的增强和对室内空气品质的日益关注是推动这一需求的关键因素。许多家庭都采用吸尘器作为必不可少的清洁用具,特别是随着过敏、呼吸问题和其他与室内空气条件差有关的健康问题的发病率不断上升。消费者正在积极寻求具有先进过滤系统的型号,这些系统可以捕捉灰尘、螨虫和空气中的颗粒,有助于创造更清洁的生活环境。製造商正在透过推出节能、注重健康的设计来满足现代用户的期望。
吸尘器技术的创新促进了具有增强功能的型号的开发,包括抗菌涂层和专为有效去除宠物毛髮而设计的工具。智慧技术也正在成为现代吸尘器的决定性因素,影响製造商整合智慧系统,以优化清洁性能并节省能源。这些进步正在影响购买决策,品牌在行销策略中越来越强调健康益处和效率。
| 市场范围 | |
|---|---|
| 起始年份 | 2024 |
| 预测年份 | 2025-2034 |
| 起始值 | 259亿美元 |
| 预测值 | 425亿美元 |
| 复合年增长率 | 5% |
市场细分为各种产品类型,包括无线、直立、罐式、中央、滚筒、干湿、机器人和其他型号。无线吸尘器是该领域的佼佼者,2024 年市场规模达 79 亿美元,预计到 2034 年将达到 142 亿美元。由于其易于使用、设计轻巧,并且在不同清洁场景中性能强劲,这一类别仍然很受欢迎。各种类型的吸尘器可满足特定的清洁需求 - 有些可以为较大的地毯区域提供强大的吸力,而有些则可以为硬地板和紧凑空间提供机动性。受低维护、自动化清洁解决方案需求的推动,机器人领域持续获得发展动力。
到 2024 年,线下配销通路将占总销售额的约 57.8%,预计未来十年将稳定成长。传统零售店,包括百货公司和专门家电商店,由于能够提供实际的产品演示而仍然具有重要意义。顾客喜欢在购买前亲自检查吸尘器,以评估其设计、功能和操作的简易性。训练有素的销售专业人员还可以引导买家选择符合其需求和偏好的车型。
在美国,家用吸尘器市场以每年 5% 的速度成长,需求集中在配备智慧功能、无线操作和强大吸力的机型。消费者对整合应用程式连接、语音控制和多功能性能的吸尘器越来越感兴趣。随着人们健康意识的增强,配备先进过滤系统、旨在减少过敏原和空气污染物的吸尘器的普及率越来越高,这也凸显了它们在维持更好的室内空气品质方面的重要性。
目录
第一章:方法论与范围
- 市场范围和定义
- 基础估算与计算
- 预测参数
- 资料来源
- 基本的
- 次要
- 付费来源
- 公共资源
第二章:执行摘要
第三章:行业洞察
- 产业生态系统分析
- 影响价值链的因素
- 利润率分析
- 中断
- 未来展望
- 製造商
- 经销商
- 零售商
- 衝击力
- 成长动力
- 都市化和可支配所得的增加
- 技术创新
- 更加重视健康和卫生
- 产业陷阱与挑战
- 环境问题和电子垃圾
- 激烈的竞争和价格敏感性
- 成长动力
- 消费者购买行为分析
- 人口趋势
- 影响购买决策的因素
- 消费者产品采用
- 首选配销通路
- 首选价格范围
- 成长潜力分析
- 监管格局
- 定价分析
- 波特的分析
- PESTEL分析
第四章:竞争格局
- 介绍
- 公司市占率分析
- 竞争定位矩阵
- 战略展望矩阵
第五章:市场估计与预测:按类型,2021 年至 2034 年
- 主要趋势
- 无线
- 直立
- 罐
- 中央
- 鼓
- 干湿两用
- 机器人
- 其他的
第六章:市场估计与预测:依配销通路,2021 年至 2034 年
- 主要趋势
- 在线的
- 离线
第七章:市场估计与预测:按地区,2021 年至 2034 年
- 主要趋势
- 北美洲
- 我们
- 加拿大
- 欧洲
- 英国
- 德国
- 法国
- 义大利
- 西班牙
- 亚太地区
- 中国
- 日本
- 印度
- 韩国
- 澳洲
- 拉丁美洲
- 巴西
- 墨西哥
- MEA
- 南非
- 沙乌地阿拉伯
- 阿联酋
第八章:公司简介
- Bissell Inc.
- De'Longhi Appliances Srl
- Dyson Ltd.
- Electrolux AB
- Eureka
- Hoover
- iRobot Corporation
- LG Electronics Inc.
- Miele & Cie. KG
- Panasonic Corporation
- Philips Electronics NV
- Rowenta (SEB Group)
- Samsung Electronics Co., Ltd.
- SharkNinja Operating LLC
- Vorwerk & Co. Interhold AG
The Global Household Vacuum Cleaner Market was valued at USD 25.9 billion in 2024 and is set to expand at a CAGR of 5% from 2025 to 2034. Increasing hygiene awareness and rising concerns over indoor air quality are key factors driving this demand. Many households are adopting vacuum cleaners as essential cleaning appliances, particularly with the growing incidence of allergies, respiratory issues, and other health concerns linked to poor indoor air conditions. Consumers are actively seeking models with advanced filtration systems that can trap dust, mites, and airborne particles, contributing to cleaner living environments. Manufacturers are responding by introducing energy-efficient, health-conscious designs that cater to modern user expectations.
Innovation in vacuum cleaner technology has led to the development of models with enhanced features, including antimicrobial coatings and tools designed for efficient pet hair removal. Smart technology is also becoming a defining aspect of modern vacuum cleaners, influencing manufacturers to integrate intelligent systems that optimize cleaning performance while conserving energy. These advancements are shaping purchasing decisions, with brands increasingly highlighting health benefits and efficiency in their marketing strategies.
| Market Scope | |
|---|---|
| Start Year | 2024 |
| Forecast Year | 2025-2034 |
| Start Value | $25.9 Billion |
| Forecast Value | $42.5 Billion |
| CAGR | 5% |
The market is segmented into various product types, including cordless, upright, canister, central, drum, wet/dry, robotic, and other models. Cordless vacuum cleaners, leading the segment, generated USD 7.9 billion in 2024 and are on track to reach USD 14.2 billion by 2034. This category remains popular due to its ease of use, lightweight design, and strong performance in different cleaning scenarios. Various vacuum types cater to specific cleaning needs-some offer powerful suction for larger carpeted areas, while others provide maneuverability for hard floors and compact spaces. The robotic segment continues to gain traction, driven by demand for low-maintenance, automated cleaning solutions.
The offline distribution channel accounted for approximately 57.8% of total sales in 2024, with steady growth projected over the next decade. Traditional retail outlets, including department stores and specialized appliance shops, remain significant due to their ability to offer hands-on product demonstrations. Customers prefer examining vacuum cleaners in person to assess design, functionality, and ease of operation before making a purchase. Trained sales professionals also play a role in guiding buyers toward models that align with their needs and preferences.
In the United States, the household vacuum cleaner market is growing at an annual rate of 5%, with demand focused on models equipped with smart features, cordless operation, and powerful suction capabilities. Consumers are increasingly interested in vacuums that integrate app connectivity, voice control, and multifunctional performance. As health consciousness rises, vacuum cleaners featuring advanced filtration systems designed to reduce allergens and airborne pollutants are seeing heightened adoption, reinforcing their importance in maintaining better indoor air quality.
Table of Contents
Chapter 1 Methodology & Scope
- 1.1 Market scope & definition
- 1.2 Base estimates & calculations
- 1.3 Forecast parameters
- 1.4 Data sources
- 1.4.1 Primary
- 1.5 Secondary
- 1.5.1.1 Paid sources
- 1.5.1.2 Public sources
Chapter 2 Executive Summary
- 2.1 Industry synopsis, 2021 - 2034
Chapter 3 Industry Insights
- 3.1 Industry ecosystem analysis
- 3.1.1 Factor affecting the value chain
- 3.1.2 Profit margin analysis
- 3.1.3 Disruptions
- 3.1.4 Future outlook
- 3.1.5 Manufacturers
- 3.1.6 Distributors
- 3.1.7 Retailers
- 3.2 Impact forces
- 3.2.1 Growth drivers
- 3.2.1.1 Urbanization and rising disposable incomes
- 3.2.1.2 Technological innovations
- 3.2.1.3 Increased focus on health and hygiene
- 3.2.2 Industry pitfalls & challenges
- 3.2.2.1 Environmental concerns and e-waste
- 3.2.2.2 Intense competition and price sensitivity
- 3.2.1 Growth drivers
- 3.3 Consumer buying behavior analysis
- 3.3.1 Demographic trends
- 3.3.2 Factors affecting buying decision
- 3.3.3 Consumer product adoption
- 3.3.4 Preferred distribution channel
- 3.3.5 Preferred price range
- 3.4 Growth potential analysis
- 3.5 Regulatory landscape
- 3.6 Pricing analysis
- 3.7 Porter's analysis
- 3.8 PESTEL analysis
Chapter 4 Competitive Landscape, 2024
- 4.1 Introduction
- 4.2 Company market share analysis
- 4.3 Competitive positioning matrix
- 4.4 Strategic outlook matrix
Chapter 5 Market Estimates and Forecast, By Type, 2021 – 2034 (USD Billion) (Thousand Units)
- 5.1 Key trends
- 5.2 Cordless
- 5.3 Upright
- 5.4 Canister
- 5.5 Central
- 5.6 Drum
- 5.7 Wet/Dry
- 5.8 Robotic
- 5.9 Others
Chapter 6 Market Estimates & Forecast, By Distribution Channel, 2021 – 2034, (USD Billion) (Thousand Units)
- 6.1 Key trends
- 6.2 Online
- 6.3 Offline
Chapter 7 Market Estimates & Forecast, By Region, 2021 – 2034, (USD Billion) (Thousand Units)
- 7.1 Key trends
- 7.2 North America
- 7.2.1 U.S.
- 7.2.2 Canada
- 7.3 Europe
- 7.3.1 UK
- 7.3.2 Germany
- 7.3.3 France
- 7.3.4 Italy
- 7.3.5 Spain
- 7.4 Asia Pacific
- 7.4.1 China
- 7.4.2 Japan
- 7.4.3 India
- 7.4.4 South Korea
- 7.4.5 Australia
- 7.5 Latin America
- 7.5.1 Brazil
- 7.5.2 Mexico
- 7.6 MEA
- 7.6.1 South Africa
- 7.6.2 Saudi Arabia
- 7.6.3 UAE
Chapter 8 Company Profiles (Business Overview, Financial Data, Product Landscape, Strategic Outlook, SWOT Analysis)
- 8.1 Bissell Inc.
- 8.2 De'Longhi Appliances S.r.l.
- 8.3 Dyson Ltd.
- 8.4 Electrolux AB
- 8.5 Eureka
- 8.6 Hoover
- 8.7 iRobot Corporation
- 8.8 LG Electronics Inc.
- 8.9 Miele & Cie. KG
- 8.10 Panasonic Corporation
- 8.11 Philips Electronics N.V.
- 8.12 Rowenta (SEB Group)
- 8.13 Samsung Electronics Co., Ltd.
- 8.14 SharkNinja Operating LLC
- 8.15 Vorwerk & Co. Interhold AG

