


 |
市场调查报告书
商品编码
1708194
商用车尿素罐市场机会、成长动力、产业趋势分析及 2025 - 2034 年预测Commercial Vehicle Urea Tank Market Opportunity, Growth Drivers, Industry Trend Analysis, and Forecast 2025 - 2034 |
||||||
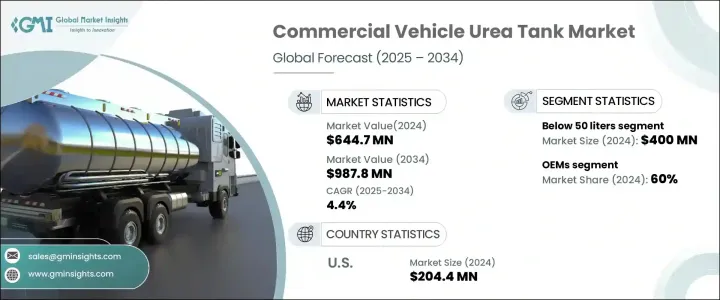
2024 年全球商用车尿素罐市场规模达到 6.447 亿美元,预计 2025 年至 2034 年期间的复合年增长率为 4.4%。市场成长主要受到严格的环境法规、选择性催化还原 (SCR) 系统采用率的提高以及减少有害氮氧化物 (NOx) 排放的力度加大的推动。欧盟、印度和中国等世界各国政府和监管机构正在实施严格的排放标准,包括欧盟 VI、印度第六阶段 (BS-VI) 和中国 VI,这些标准要求商用车製造商采用先进的尿素喷射技术。这些系统提高了燃油效率和性能,同时确保符合排放标准。
此外,人们越来越意识到氮氧化物排放对公众健康和环境的不利影响,这也鼓励车队营运商投资配备 SCR 系统的车辆。对符合监管要求的节能汽车的需求不断增长,进一步推动了尿素罐的采用,为市场持续成长奠定了基础。配备先进排放控制系统的新型商用车越来越多地取代旧款商用车,这是推动市场上升趋势的另一个因素。电子商务和城市配送服务的扩张等物流和运输领域的不断发展的趋势也推动了对配备高效排放控制系统的商用车的需求。
| 市场范围 | |
|---|---|
| 起始年份 | 2024 |
| 预测年份 | 2025-2034 |
| 起始值 | 6.447亿美元 |
| 预测值 | 9.878亿美元 |
| 复合年增长率 | 4.4% |
商用车尿素罐市场依容量分为50公升以下、50-100公升、100公升以上三类。 50 公升以下市场的销售额在 2024 年达到了 4 亿美元,并且由于其广泛应用于送货车和城市公车等轻型和中型商用车,将继续占据市场主导地位。这些车辆在较短的路线上运行,并且受益于较小的尿素罐,可减轻车辆重量、提高燃油效率并降低营运成本。製造小型油箱的成本效益及其与城市交通需求的兼容性正在推动这一领域的成长。
市场还根据销售管道进行划分,其中原始设备製造商 (OEM) 和售后市场是主要贡献者。 2024 年,OEM 部门占据了 60% 的市场份额,这主要归功于新製造的商用车中 SCR 系统的日益整合。随着更严格的排放标准成为强制性要求,SCR 技术正在成为新车的标准配置,从而推动了对由 OEM 直接供应的尿素罐的持续需求。人们之所以偏好OEM提供的零件,是因为其具有高品质标准、与车型相容、可靠地满足排放法规等特点。
2024 年,美国商用车尿素罐市场规模达 2.044 亿美元,预计 2025 年至 2034 年期间的复合年增长率为 4.7%。这一增长主要得益于美国环保署 (EPA) 等机构实施的严格排放法规以及商用车中 SCR 系统的日益普及。美国环保署温室气体第二阶段法规和加州空气资源委员会(CARB)法规的实施大大增加了轻型和重型商用车对尿素罐的需求。随着美国继续推动更清洁的运输技术和更严格的排放标准,对高性能尿素罐的需求预计将稳步上升,从而进一步促进未来几年市场的成长。
目录
第一章:方法论与范围
- 研究设计
- 研究方法
- 资料收集方法
- 基础估算与计算
- 基准年计算
- 市场评估的主要趋势
- 预测模型
- 初步研究和验证
- 主要来源
- 资料探勘来源
- 市场范围和定义
第二章:执行摘要
第三章:行业洞察
- 产业生态系统分析
- 供应商格局
- 原物料供应商
- 组件提供者
- 製造商
- 技术提供者
- 配销通路分析
- 最终用途
- 利润率分析
- 供应商格局
- 技术与创新格局
- 专利分析
- 监管格局
- 成本細項分析
- 重要新闻和倡议
- 衝击力
- 成长动力
- 商用车产量成长与车队扩张
- 尿素罐技术的进步
- 严格的排放法规
- 物流运输业的扩张
- 产业陷阱与挑战
- SCR 系统和尿素罐的初始成本高
- 尿素结晶和结冻问题
- 成长动力
- 成长潜力分析
- 波特的分析
- PESTEL分析
第四章:竞争格局
- 介绍
- 公司市占率分析
- 竞争定位矩阵
- 战略展望矩阵
第五章:市场估计与预测:依产能,2021 - 2034 年
- 主要趋势
- 50公升以下
- 50至100公升
- 100公升以上
第六章:市场估计与预测:依资料,2021 - 2034 年
- 主要趋势
- 不銹钢
- 塑胶
- 合成的
第七章:市场估计与预测:按应用,2021 - 2034 年
- 主要趋势
- 轻型商用车(LCV)
- 中型商用车(MCV)
- 重型商用车(HCV)
第八章:市场估计与预测:依销售管道,2021 - 2034 年
- 主要趋势
- OEM
- 售后市场
第九章:市场估计与预测:按地区,2021 - 2034 年
- 主要趋势
- 北美洲
- 我们
- 加拿大
- 欧洲
- 德国
- 法国
- 英国
- 西班牙
- 义大利
- 俄罗斯
- 北欧人
- 亚太地区
- 中国
- 印度
- 日本
- 韩国
- 澳新银行
- 东南亚
- 拉丁美洲
- 巴西
- 墨西哥
- 阿根廷
- MEA
- 阿联酋
- 南非
- 沙乌地阿拉伯
第十章:公司简介
- ACGB
- Amphenol
- Centro Incorporated
- Cummins
- Dongguan Zhengyang Electronic Mechanical (KUS Auto)
- Elkamet
- Elkhart Plastics
- Gemini Group
- Hitachi Zosen
- ITB Group
- KaiLong
- Kingspan
- Robert Bosch
- Rochling
- Salzburger Aluminium
- Scania AB
- Shaw Development
- Solar Plastics
- SSI Technologies
- Yara International ASA
The Global Commercial Vehicle Urea Tank Market reached USD 644.7 million in 2024 and is projected to grow at a CAGR of 4.4% between 2025 and 2034. The market growth is primarily driven by stringent environmental regulations, rising adoption of selective catalytic reduction (SCR) systems, and increasing efforts to reduce harmful nitrogen oxide (NOx) emissions. Governments and regulatory bodies worldwide, such as the European Union, India, and China, are enforcing strict emission standards, including Euro VI, Bharat Stage VI (BS-VI), and China VI, which require commercial vehicle manufacturers to integrate advanced urea injection technologies. These systems enhance fuel efficiency and performance while ensuring compliance with emission norms.
Additionally, rising awareness about the adverse effects of NOx emissions on public health and the environment is encouraging fleet operators to invest in vehicles equipped with SCR systems. Growing demand for fuel-efficient vehicles that comply with regulatory requirements is further driving the adoption of urea tanks, positioning the market for sustained growth. The increasing replacement of older commercial vehicles with newer models featuring advanced emission control systems is another factor contributing to the market's upward trajectory. Evolving trends in the logistics and transportation sectors, including the expansion of e-commerce and urban delivery services, are also boosting the demand for commercial vehicles with efficient emission control systems.
| Market Scope | |
|---|---|
| Start Year | 2024 |
| Forecast Year | 2025-2034 |
| Start Value | $644.7 Million |
| Forecast Value | $987.8 Million |
| CAGR | 4.4% |
The commercial vehicle urea tank market is segmented by capacity into three categories: below 50 liters, 50 to 100 liters, and above 100 liters. The below 50 liters segment generated USD 400 million in 2024 and continues to dominate the market due to its widespread application in light and medium-duty commercial vehicles, such as delivery vans and urban buses. These vehicles operate on shorter routes and benefit from smaller urea tanks that reduce vehicle weight, enhance fuel efficiency, and lower operational costs. The cost-effectiveness of manufacturing smaller tanks and their compatibility with urban transport needs are driving this segment's growth.
The market is also divided based on sales channels, with Original Equipment Manufacturers (OEMs) and the aftermarket being the key contributors. The OEMs segment held a 60% market share in 2024, largely due to the increasing integration of SCR systems in newly manufactured commercial vehicles. As stricter emission standards become mandatory, SCR technology is becoming a standard feature in new vehicles, driving consistent demand for urea tanks supplied directly by OEMs. The preference for OEM-supplied components stems from their high-quality standards, compatibility with vehicle models, and reliability in meeting emission regulations.
The U.S. commercial vehicle urea tank market generated USD 204.4 million in 2024 and is expected to grow at a CAGR of 4.7% between 2025 and 2034. This growth is fueled by stringent emission regulations enforced by agencies such as the Environmental Protection Agency (EPA) and the increasing use of SCR systems in commercial vehicles. The implementation of the EPA's Greenhouse Gas Phase 2 regulations and California Air Resources Board (CARB) mandates has significantly boosted the demand for urea tanks in both light and heavy commercial vehicles. As the U.S. continues to push for cleaner transportation technologies and tighter emission standards, the demand for high-performance urea tanks is expected to rise steadily, further enhancing the growth of the market in the coming years.
Table of Contents
Chapter 1 Methodology & Scope
- 1.1 Research design
- 1.1.1 Research approach
- 1.1.2 Data collection methods
- 1.2 Base estimates & calculations
- 1.2.1 Base year calculation
- 1.2.2 Key trends for market estimation
- 1.3 Forecast model
- 1.4 Primary research and validation
- 1.4.1 Primary sources
- 1.4.2 Data mining sources
- 1.5 Market scope & definition
Chapter 2 Executive Summary
- 2.1 Industry 3600 synopsis, 2021 - 2034
Chapter 3 Industry Insights
- 3.1 Industry ecosystem analysis
- 3.1.1 Supplier landscape
- 3.1.1.1 Raw material providers
- 3.1.1.2 Component providers
- 3.1.1.3 Manufacturers
- 3.1.1.4 Technology providers
- 3.1.1.5 Distribution channel analysis
- 3.1.1.6 End use
- 3.1.2 Profit margin analysis
- 3.1.1 Supplier landscape
- 3.2 Technology & innovation landscape
- 3.3 Patent analysis
- 3.4 Regulatory landscape
- 3.5 Cost breakdown analysis
- 3.6 Key news & initiatives
- 3.7 Impact forces
- 3.7.1 Growth drivers
- 3.7.1.1 Growth in commercial vehicle production & fleet expansion
- 3.7.1.2 Advancements in urea tank technology
- 3.7.1.3 Stringent emission regulations
- 3.7.1.4 Expansion of logistics & transportation industry
- 3.7.2 Industry pitfalls & challenges
- 3.7.2.1 High initial costs of SCR systems & urea tanks
- 3.7.2.2 Issues with urea crystallization & freezing
- 3.7.1 Growth drivers
- 3.8 Growth potential analysis
- 3.9 Porter's analysis
- 3.10 PESTEL analysis
Chapter 4 Competitive Landscape, 2024
- 4.1 Introduction
- 4.2 Company market share analysis
- 4.3 Competitive positioning matrix
- 4.4 Strategic outlook matrix
Chapter 5 Market Estimates & Forecast, By Capacity, 2021 - 2034 ($Mn, Units)
- 5.1 Key trends
- 5.2 Below 50 liters
- 5.3 50 to 100 liters
- 5.4 Above 100 liters
Chapter 6 Market Estimates & Forecast, By Material, 2021 - 2034 ($Mn, Units)
- 6.1 Key trends
- 6.2 Stainless steel
- 6.3 Plastic
- 6.4 Composite
Chapter 7 Market Estimates & Forecast, By Application, 2021 - 2034 ($Mn, Units)
- 7.1 Key trends
- 7.2 Light Commercial Vehicles (LCV)
- 7.3 Medium Commercial Vehicles (MCV)
- 7.4 Heavy Commercial Vehicles (HCV)
Chapter 8 Market Estimates & Forecast, By Sales Channel, 2021 - 2034 ($Mn, Units)
- 8.1 Key trends
- 8.2 OEM
- 8.3 Aftermarket
Chapter 9 Market Estimates & Forecast, By Region, 2021 - 2034 ($Mn, Units)
- 9.1 Key trends
- 9.2 North America
- 9.2.1 U.S.
- 9.2.2 Canada
- 9.3 Europe
- 9.3.1 Germany
- 9.3.2 France
- 9.3.3 UK
- 9.3.4 Spain
- 9.3.5 Italy
- 9.3.6 Russia
- 9.3.7 Nordics
- 9.4 Asia Pacific
- 9.4.1 China
- 9.4.2 India
- 9.4.3 Japan
- 9.4.4 South Korea
- 9.4.5 ANZ
- 9.4.6 Southeast Asia
- 9.5 Latin America
- 9.5.1 Brazil
- 9.5.2 Mexico
- 9.5.3 Argentina
- 9.6 MEA
- 9.6.1 UAE
- 9.6.2 South Africa
- 9.6.3 Saudi Arabia
Chapter 10 Company Profiles
- 10.1 ACGB
- 10.2 Amphenol
- 10.3 Centro Incorporated
- 10.4 Cummins
- 10.5 Dongguan Zhengyang Electronic Mechanical (KUS Auto)
- 10.6 Elkamet
- 10.7 Elkhart Plastics
- 10.8 Gemini Group
- 10.9 Hitachi Zosen
- 10.10 ITB Group
- 10.11 KaiLong
- 10.12 Kingspan
- 10.13 Robert Bosch
- 10.14 Rochling
- 10.15 Salzburger Aluminium
- 10.16 Scania AB
- 10.17 Shaw Development
- 10.18 Solar Plastics
- 10.19 SSI Technologies
- 10.20 Yara International ASA


