


 |
市场调查报告书
商品编码
1716482
冷藏展示柜市场机会、成长动力、产业趋势分析及 2025 - 2034 年预测Refrigerated Display Cases Market Opportunity, Growth Drivers, Industry Trend Analysis, and Forecast 2025 - 2034 |
||||||
2024 年全球冷藏展示柜市场价值为 372 亿美元,预计 2025 年至 2034 年期间的复合年增长率为 6%。对节能製冷系统的需求不断增长以及对食品安全的日益关注是推动市场成长的主要因素。随着零售店、超市和饭店企业继续专注于提供新鲜和对温度敏感的产品,对先进冷藏展示柜的需求正在增加。此外,在更严格的政府法规和永续发展目标的推动下,环保冷冻解决方案的趋势日益增长,促使製造商开发消耗更少能源并减少环境影响的创新系统。智慧冷却系统、自动温度监控和节能 LED 照明等技术进步进一步增强了现代冷藏展示柜的吸引力。此外,物联网功能的整合正在帮助企业在维持产品品质的同时提高营运效率,这对市场的上升趋势做出了重大贡献。
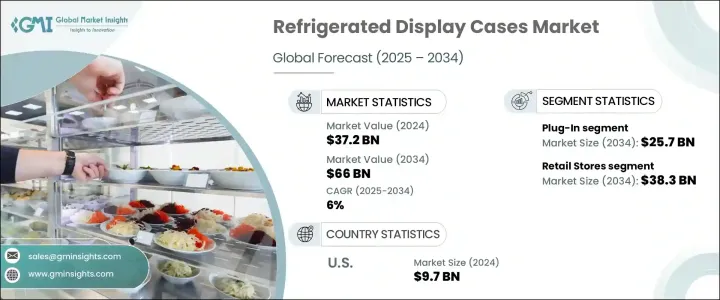
冷藏展示柜市场分为三大主要产品类别:插入式、半插入式和远端系统。插电式汽车在 2024 年创造了 152 亿美元的市场规模,成为最受欢迎的细分市场。它们易于安装和移动,并且无需外部冷凝器或复杂管道即可独立运行,使其成为小型零售店、快闪店和临时设置的理想选择。随着全球中小型零售企业数量的增加,对便携式、易于安装的冷冻解决方案的需求预计将持续成长。
| 市场范围 | |
|---|---|
| 起始年份 | 2024 |
| 预测年份 | 2025-2034 |
| 起始值 | 372亿美元 |
| 预测值 | 660亿美元 |
| 复合年增长率 | 6% |
在应用方面,市场主要分为零售店、餐厅和酒店以及其他行业。零售店占 2024 年总市占率的 56.1%,预计到 2034 年将达到 383 亿美元。这一增长是由对食品安全和保持产品新鲜度的日益重视所推动的。零售商正在投资温控製冷设备,以延长产品保质期,同时遵守政府规定的可持续性标准。这些设备采用了智慧冷却、节能压缩机和 LED 照明系统等现代化技术,有助于降低营运成本并提高整体能源效率。
受美国食品零售和加工产业蓬勃发展的推动,美国冷藏展示柜市场到 2024 年将创造 97 亿美元的收入。超市、便利商店和食品服务机构数量的不断增加推动了对高品质、可靠冷却系统的需求。由于食品安全和能源效率仍然是美国市场的首要任务,企业越来越多地采用配备节能功能和改进的冷却技术的先进冷藏展示柜来满足这些日益增长的需求。
目录
第一章:方法论与范围
第二章:执行摘要
第三章:行业洞察
- 产业生态系统分析
- 影响价值链的因素
- 利润率分析
- 中断
- 未来展望
- 製造商
- 经销商
- 零售商
- 衝击力
- 成长动力
- 对新鲜和易腐食品的需求不断增加
- 零售和食品服务业的采用率不断提高
- 能源效率技术进步
- 消费者对方便即食食品的偏好日益增加
- 产业陷阱与挑战
- 初始成本和维护费用高
- 严格的能源消耗监管要求
- 成长动力
- 消费者购买行为分析
- 人口趋势
- 影响购买决策的因素
- 消费者产品采用
- 首选配销通路
- 首选价格范围
- 成长潜力分析
- 监管格局
- 定价分析
- 波特的分析
- PESTEL分析
第四章:竞争格局
- 介绍
- 公司市占率分析
- 竞争定位矩阵
- 战略展望矩阵
第五章:市场估计与预测:依产品类型,2021 年至 2034 年
- 主要趋势
- 外挂
- 半插电式
- 偏僻的
第六章:市场估计与预测:按应用,2021 年至 2034 年
- 主要趋势
- 零售店
- 餐厅和饭店
- 其他的
第七章:市场估计与预测:依设计,2021 年至 2034 年
- 主要趋势
- 垂直的
- 水平的
- 杂交种
第八章:市场估计与预测:依最终用途,2021 年至 2034 年
- 主要趋势
- 超市
- 便利商店
第九章:市场估计与预测:按地区,2021 年至 2034 年
- 主要趋势
- 北美洲
- 我们
- 加拿大
- 欧洲
- 德国
- 英国
- 法国
- 义大利
- 西班牙
- 亚太地区
- 中国
- 印度
- 日本
- 韩国
- 澳洲
- 拉丁美洲
- 巴西
- 墨西哥
- 阿根廷
- MEA
- 沙乌地阿拉伯
- 阿联酋
- 南非
第十章:公司简介
- Arneg SPA
- Daikin Industries, Ltd.
- Danfoss A/S
- EPTA SPA Refrigeration
- Haier Group
- Hoshizaki International
- Hussmann Corporation
- Illinois Tool Works Inc.
- Lennox International
- Metalfrio Solutions SA
The Global Refrigerated Display Cases Market was valued at USD 37.2 billion in 2024 and is projected to grow at a CAGR of 6% between 2025 and 2034. The rising demand for energy-efficient refrigeration systems and increasing concerns about food safety are major factors driving the market's growth. As retail stores, supermarkets, and hospitality businesses continue to focus on offering fresh and temperature-sensitive products, the need for advanced refrigerated display cases is on the rise. Additionally, the growing trend toward eco-friendly refrigeration solutions, driven by stricter government regulations and sustainability goals, is pushing manufacturers to develop innovative systems that consume less energy and reduce environmental impact. Technological advancements, such as smart cooling systems, automated temperature monitoring, and energy-efficient LED lighting, further enhance the appeal of modern refrigerated display cases. Moreover, the integration of IoT-enabled features is helping businesses improve operational efficiency while maintaining product quality, which contributes significantly to the market's upward trajectory.
The refrigerated display cases market is segmented into three main product categories: Plug-In, Semi Plug-In, and Remote systems. Plug-In units generated USD 15.2 billion in 2024, making them the most popular segment. Their ease of installation and mobility, combined with their ability to operate independently without external condensers or complex piping, makes them ideal for small retail outlets, pop-up stores, and temporary setups. As the number of small and medium-sized retail businesses increases globally, the demand for portable and easy-to-install refrigeration solutions is expected to continue growing.
| Market Scope | |
|---|---|
| Start Year | 2024 |
| Forecast Year | 2025-2034 |
| Start Value | $37.2 Billion |
| Forecast Value | $66 Billion |
| CAGR | 6% |
In terms of application, the market is primarily segmented into Retail Stores, Restaurants & Hotels, and Other sectors. Retail Stores accounted for 56.1% of the total market share in 2024 and are expected to reach USD 38.3 billion by 2034. This growth is driven by an increased focus on food safety and maintaining product freshness. Retailers are investing in temperature-controlled refrigeration units that extend product shelf life while adhering to government-mandated sustainability standards. These units incorporate modern technologies such as smart cooling, energy-efficient compressors, and LED lighting systems, which help reduce operational costs and improve overall energy efficiency.
The U.S. refrigerated display cases market generated USD 9.7 billion in 2024, driven by the country's robust food retail and processing industries. The rising number of supermarkets, convenience stores, and food service establishments has fueled the demand for high-quality, reliable refrigeration systems. As food safety and energy efficiency remain top priorities in the U.S. market, businesses are increasingly adopting advanced refrigerated display cases equipped with energy-saving features and improved cooling technologies to meet these growing demands.
Table of Contents
Chapter 1 Methodology & Scope
- 1.1 Market scope & definition
- 1.2 Base estimates & calculations
- 1.3 Forecast parameters
- 1.4 Data sources
- 1.4.1 Primary
- 1.4.2 Secondary
- 1.4.2.1 Paid sources
- 1.4.2.2 Public sources
Chapter 2 Executive Summary
- 2.1 Industry 3600 synopsis, 2021 - 2034
Chapter 3 Industry Insights
- 3.1 Industry ecosystem analysis
- 3.1.1 Factors affecting the value chain
- 3.1.2 Profit margin analysis
- 3.1.3 Disruptions
- 3.1.4 Future outlook
- 3.1.5 Manufacturers
- 3.1.6 Distributors
- 3.1.7 Retailers
- 3.2 Impact forces
- 3.2.1 Growth drivers
- 3.2.1.1 Increasing demand for fresh and perishable food
- 3.2.1.2 Growing adoption in the retail and food service sectors
- 3.2.1.3 Technological advancements in energy efficiency
- 3.2.1.4 Rising consumer preference for convenient and ready-to-eat food
- 3.2.2 Industry pitfalls & challenges
- 3.2.2.1 High initial cost and maintenance expenses
- 3.2.2.2 Stringent regulatory requirements for energy consumption
- 3.2.1 Growth drivers
- 3.3 Consumer buying behavior analysis
- 3.3.1 Demographic trends
- 3.3.2 Factors affecting buying decision
- 3.3.3 Consumer product adoption
- 3.3.4 Preferred distribution channel
- 3.3.5 Preferred price range
- 3.4 Growth potential analysis
- 3.5 Regulatory landscape
- 3.6 Pricing analysis
- 3.7 Porter's analysis
- 3.8 PESTEL analysis
Chapter 4 Competitive Landscape, 2024
- 4.1 Introduction
- 4.2 Company market share analysis
- 4.3 Competitive positioning matrix
- 4.4 Strategic outlook matrix
Chapter 5 Market Estimates & Forecast, By Product Type, 2021 – 2034, (USD Billion) (Million Units)
- 5.1 Key trends
- 5.2 Plug-in
- 5.3 Semi plug-in
- 5.4 Remote
Chapter 6 Market Estimates & Forecast, By Application, 2021 – 2034, (USD Billion) (Million Units)
- 6.1 Key trends
- 6.2 Retail stores
- 6.3 Restaurants & hotels
- 6.4 Others
Chapter 7 Market Estimates & Forecast, By Design, 2021 – 2034, (USD Billion) (Million Units)
- 7.1 Key trends
- 7.2 Vertical
- 7.3 Horizontal
- 7.4 Hybrid
Chapter 8 Market Estimates & Forecast, By End Use, 2021 – 2034, (USD Billion) (Million Units)
- 8.1 Key trends
- 8.2 Supermarkets
- 8.3 Convenience stores
Chapter 9 Market Estimates & Forecast, By Region, 2021 – 2034, (USD Billion) (Million Units)
- 9.1 Key trends
- 9.2 North America
- 9.2.1 U.S.
- 9.2.2 Canada
- 9.3 Europe
- 9.3.1 Germany
- 9.3.2 UK
- 9.3.3 France
- 9.3.4 Italy
- 9.3.5 Spain
- 9.4 Asia Pacific
- 9.4.1 China
- 9.4.2 India
- 9.4.3 Japan
- 9.4.4 South Korea
- 9.4.5 Australia
- 9.5 Latin America
- 9.5.1 Brazil
- 9.5.2 Mexico
- 9.5.3 Argentina
- 9.6 MEA
- 9.6.1 Saudi Arabia
- 9.6.2 UAE
- 9.6.3 South Africa
Chapter 10 Company Profiles (Business Overview, Financial Data, Product Landscape, Strategic Outlook, SWOT Analysis)
- 10.1 Arneg S.P.A
- 10.2 Daikin Industries, Ltd.
- 10.3 Danfoss A/S
- 10.4 EPTA S.P.A Refrigeration
- 10.5 Haier Group
- 10.6 Hoshizaki International
- 10.7 Hussmann Corporation
- 10.8 Illinois Tool Works Inc.
- 10.9 Lennox International
- 10.10 Metalfrio Solutions S.A.
 义式霜淇淋展示柜市场:依产品类型、门类型、容量范围、最终用户和安装方式划分,全球预测(2026-2032年)
 2026年全球保温器展示柜市场报告2026年全球冷藏展示柜市场报告2026年全球冷藏展示柜市场报告2026年全球檯式保温器与展示柜市场报告
 冷藏展示柜市场-全球产业规模、份额、趋势、机会、预测:按产品类型、产品设计、地区和竞争格局划分,2021-2031年全球桌上型披萨保温器及展示柜市场(依产品类型、容量、通路及应用划分)预测(2026-2032年)熟食服饰市场依材料类型、包装规格、价格范围、闭合方式、应用领域及通路划分,全球预测(2026-2032年)玻璃门冷冻库市场按产品类型、安装方式、最终用户和分销管道划分-全球预测,2026-2032年
 冷藏展示柜市场规模、份额及成长分析(依产品类型、终端用户产业、冷却方式、材质、应用及地区划分)-2026-2033年产业预测