


 |
市场调查报告书
商品编码
1716496
水力发电涡轮机市场机会、成长动力、产业趋势分析及 2025 - 2034 年预测Hydropower Turbine Market Opportunity, Growth Drivers, Industry Trend Analysis, and Forecast 2025 - 2034 |
||||||
2024 年全球水力发电涡轮机市场规模达 585 亿美元,预计 2025 年至 2034 年期间的复合年增长率为 3.4%。全球对可靠和可持续电力来源日益增长的需求正在推动这一扩张。水力发电以其大规模生产清洁能源的能力而闻名,正成为满足发展中国家和已开发国家日益增长的电力需求的首选解决方案。对减少碳排放的日益重视,加上政府推动再生能源应用的政策,进一步增强了市场。水力发电具有无与伦比的可靠性和灵活性,使其成为风能和太阳能等其他再生能源的理想补充。
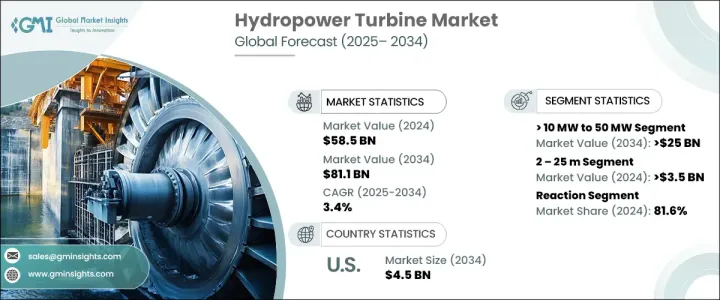
此外,涡轮机技术的进步显着提高了运作效率,降低了维护成本,并增强了水力发电项目的整体永续性。这与老化基础设施的现代化一起推动着市场向前发展。政府和私人实体正在大力投资升级水力发电厂,以满足日益增长的能源需求,同时确保将环境影响降至最低。农村和离网地区越来越多地采用小型和微型水力发电系统也促进了市场成长,为传统电网接入有限的地区提供了分散式电力解决方案。
| 市场范围 | |
|---|---|
| 起始年份 | 2024 |
| 预测年份 | 2025-2034 |
| 起始值 | 585亿美元 |
| 预测值 | 811亿美元 |
| 复合年增长率 | 3.4% |
市场根据涡轮机容量进行细分,主要类别包括<= 1 MW、> 1 MW 至 10 MW、> 10 MW 至 50 MW 和 > 50 MW。预计到 2034 年,10 MW 以上至 50 MW 部分将创造 250 亿美元的收入。这些涡轮机因其提供大规模电力输出的能力而受到青睐,使其成为人口稠密的城市地区和工业区高需求应用的理想选择。它们在电网稳定和不同负载条件下持续输送电力方面发挥着重要作用,对于满足大规模能源需求而言,它们不可或缺。由于公用事业公司和政府专注于提高电网可靠性和支持工业扩张,该领域正在经历强劲成长。
另一个关键部分是根据涡轮机类型,分为衝动式涡轮机和反作用式涡轮机。 2024年,反作用式涡轮机部分占81.6%的市占率。反击式水轮机对于中型到大型专案来说效率很高,特别是在水流量变化的地区。其环保设计最大限度地减少了对生态的破坏并支持永续能源的产生。随着政府和公用事业公司寻求以先进型号取代老旧、效率低下的涡轮机,对反击式涡轮机的需求将会成长。它们能够承受更高的水压并适应不同的操作条件,使其成为水力发电开发商的首选。
2024 年美国水力发电涡轮机市值为 44 亿美元。美国越来越关注分散式能源资源以及小型和微型水力发电项目的开发。政府旨在扩大再生能源基础设施和促进离河水力发电计画的激励措施正在推动这一成长。此外,公共和私营部门之间的合作努力正在促进技术创新并加强水力发电系统的部署。这些倡议使美国成为推动水力发电技术发展的关键参与者,并为全球市场做出重大贡献。
目录
第一章:方法论与范围
第二章:执行摘要
第三章:行业洞察
- 产业生态系统分析
- 监管格局
- 产业衝击力
- 成长动力
- 产业陷阱与挑战
- 成长潜力分析
- 波特的分析
- PESTEL分析
第四章:竞争格局
- 介绍
- 战略展望
- 创新与永续发展格局
第五章:市场规模及预测:依产能,2021 - 2034 年
- 主要趋势
- ≤1兆瓦
- > 1 MW 至 10 MW
- > 10 MW 至 50 MW
- > 50 兆瓦
第六章:市场规模及预测:依头部,2021 - 2034
- 主要趋势
- 2 – 25米
- > 25 – 70米
- > 70米
第七章:市场规模及预测:依产品,2021 - 2034
- 主要趋势
- 衝动
- 反应
第八章:市场规模及预测:按地区,2021 - 2034
- 主要趋势
- 北美洲
- 我们
- 加拿大
- 墨西哥
- 欧洲
- 法国
- 奥地利
- 挪威
- 俄罗斯
- 义大利
- 瑞士
- 土耳其
- 瑞典
- 亚太地区
- 中国
- 印度
- 越南
- 不丹
- 印尼
- 尼泊尔
- 斯里兰卡
- 中东和非洲
- 衣索比亚
- 伊朗
- 以色列
- 奈及利亚
- 尚比亚
- 拉丁美洲
- 巴西
- 秘鲁
- 阿根廷
第九章:公司简介
- ANDRITZ
- B fouress
- Dobriyal Brothers
- GE Vernova
- Gilkes
- GUGLER Water Turbines
- Jyoti
- Litostroj Power
- Mitsubishi Heavy Industries
- Natel Energy
- Pentaflo Hydro
- Siemens Energy
- Toshiba
- Turbiwatt
- Voith
The Global Hydropower Turbine Market generated USD 58.5 billion in 2024 and is projected to grow at a CAGR of 3.4% between 2025 and 2034. The growing global demand for reliable and sustainable electricity sources is fueling this expansion. Hydropower, known for its ability to generate clean energy on a large scale, is becoming a preferred solution to meet the rising electricity needs of both developing and developed nations. The increasing emphasis on reducing carbon emissions, coupled with government policies promoting renewable energy adoption, is further strengthening the market. Hydropower offers unparalleled reliability and flexibility, making it an ideal complement to other renewable sources like wind and solar energy.
Additionally, advancements in turbine technology are significantly improving operational efficiency, reducing maintenance costs, and enhancing the overall sustainability of hydropower projects. This, along with the modernization of aging infrastructure, is propelling the market forward. Governments and private entities are investing heavily in upgrading hydropower plants to meet growing energy demands while ensuring minimal environmental impact. The increasing adoption of small and micro hydropower systems in rural and off-grid regions is also contributing to market growth, offering decentralized power solutions in areas with limited access to traditional power grids.
| Market Scope | |
|---|---|
| Start Year | 2024 |
| Forecast Year | 2025-2034 |
| Start Value | $58.5 Billion |
| Forecast Value | $81.1 Billion |
| CAGR | 3.4% |
The market is segmented based on turbine capacity, with key categories including <= 1 MW, > 1 MW to 10 MW, > 10 MW to 50 MW, and > 50 MW. The > 10 MW to 50 MW segment is expected to generate USD 25 billion by 2034. These turbines are preferred for their ability to provide large-scale power output, making them ideal for high-demand applications in densely populated urban areas and industrial zones. Their role in grid stabilization and consistent power delivery under varying load conditions makes them indispensable for meeting large-scale energy requirements. This segment is experiencing strong growth as utilities and governments focus on enhancing grid reliability and supporting industrial expansion.
Another key segment is based on turbine type, categorized into impulse and reaction turbines. In 2024, the reaction turbine segment accounted for 81.6% of the market share. Reaction turbines are highly efficient for medium to large-scale projects, especially in regions with variable water flow rates. Their eco-friendly design minimizes ecological disruption and supports sustainable energy generation. As governments and utilities seek to replace older, less efficient turbines with advanced models, the demand for reaction turbines is poised to grow. Their ability to handle higher water pressures and adapt to different operating conditions makes them a preferred choice for hydropower developers.
The U.S. Hydropower Turbine Market was valued at USD 4.4 billion in 2024. The country is witnessing an increasing focus on distributed energy resources and the development of small and micro hydropower projects. Government incentives aimed at expanding renewable energy infrastructure and promoting off-river hydropower projects are driving this growth. Additionally, collaborative efforts between public and private sectors are fostering technological innovation and enhancing the deployment of hydropower systems. These initiatives are positioning the U.S. as a key player in advancing hydropower technology and contributing significantly to the global market.
Table of Contents
Chapter 1 Methodology & Scope
- 1.1 Market scope & definitions
- 1.2 Market estimates & forecast parameters
- 1.3 Forecast calculation
- 1.4 Data sources
- 1.4.1 Primary
- 1.4.2 Secondary
- 1.4.2.1 Paid
- 1.4.2.2 Public
Chapter 2 Executive Summary
- 2.1 Industry synopsis, 2021 - 2034
Chapter 3 Industry Insights
- 3.1 Industry ecosystem analysis
- 3.2 Regulatory landscape
- 3.3 Industry impact forces
- 3.3.1 Growth drivers
- 3.3.2 Industry pitfalls & challenges
- 3.4 Growth potential analysis
- 3.5 Porter's analysis
- 3.5.1 Bargaining power of suppliers
- 3.5.2 Bargaining power of buyers
- 3.5.3 Threat of new entrants
- 3.5.4 Threat of substitutes
- 3.6 PESTEL analysis
Chapter 4 Competitive Landscape, 2024
- 4.1 Introduction
- 4.2 Strategic outlook
- 4.3 Innovation & sustainability landscape
Chapter 5 Market Size and Forecast, By Capacity, 2021 - 2034 (MW & USD Million)
- 5.1 Key trends
- 5.2 ≤ 1 MW
- 5.3 > 1 MW to 10 MW
- 5.4 > 10 MW to 50 MW
- 5.5 > 50 MW
Chapter 6 Market Size and Forecast, By Head, 2021 - 2034 (MW & USD Million)
- 6.1 Key trends
- 6.2 2 – 25 m
- 6.3 > 25 – 70 m
- 6.4 > 70 m
Chapter 7 Market Size and Forecast, By Product, 2021 - 2034 (MW & USD Million)
- 7.1 Key trends
- 7.2 Impulse
- 7.3 Reaction
Chapter 8 Market Size and Forecast, By Region, 2021 - 2034 (MW & USD Million)
- 8.1 Key trends
- 8.2 North America
- 8.2.1 U.S.
- 8.2.2 Canada
- 8.2.3 Mexico
- 8.3 Europe
- 8.3.1 France
- 8.3.2 Austria
- 8.3.3 Norway
- 8.3.4 Russia
- 8.3.5 Italy
- 8.3.6 Switzerland
- 8.3.7 Turkey
- 8.3.8 Sweden
- 8.4 Asia Pacific
- 8.4.1 China
- 8.4.2 India
- 8.4.3 Vietnam
- 8.4.4 Bhutan
- 8.4.5 Indonesia
- 8.4.6 Nepal
- 8.4.7 Sri Lanka
- 8.5 Middle East & Africa
- 8.5.1 Ethiopia
- 8.5.2 Iran
- 8.5.3 Israel
- 8.5.4 Nigeria
- 8.5.5 Zambia
- 8.6 Latin America
- 8.6.1 Brazil
- 8.6.2 Peru
- 8.6.3 Argentina
Chapter 9 Company Profiles
- 9.1 ANDRITZ
- 9.2 B fouress
- 9.3 Dobriyal Brothers
- 9.4 GE Vernova
- 9.5 Gilkes
- 9.6 GUGLER Water Turbines
- 9.7 Jyoti
- 9.8 Litostroj Power
- 9.9 Mitsubishi Heavy Industries
- 9.10 Natel Energy
- 9.11 Pentaflo Hydro
- 9.12 Siemens Energy
- 9.13 Toshiba
- 9.14 Turbiwatt
- 9.15 Voith
 水轮机市场-全球产业规模、份额、趋势、机会和预测,按涡轮机类型、水头、安装地点、地区和竞争格局划分,2021-2031年预测
 水力发电机组市场(依最终用户、应用、安装类型、涡轮机容量和涡轮机类型划分)-2025-2032年全球预测
 2025年全球汽轮机和汽轮发电机组市场报告2025年全球水电池市场报告2025年水力涡轮机全球市场报告
 全球水力涡轮机市场
 水力涡轮发电机单位的全球市场:涡轮机类别,水头类别,各用途,各地区,机会,预测,2018年~2032年水力涡轮发电机单位的印度市场:涡轮机类别,水头类别,各用途,各地区,机会,预测,2019年~2033年水轮发电机组市场-全球产业规模、份额、趋势、机会和预测,按涡轮机类型、发电机类型、水头范围、应用、地区和竞争进行细分,2020-2030 年预测全球水力电池市场