


 |
市场调查报告书
商品编码
1716521
石油焦市场机会、成长动力、产业趋势分析及 2025 - 2034 年预测Petcoke Market Opportunity, Growth Drivers, Industry Trend Analysis, and Forecast 2025 - 2034 |
||||||
2024 年全球石油焦市场价值为 221 亿美元,预计 2025 年至 2034 年期间的复合年增长率为 5.9%。石油焦是一种由石油精炼产生的富碳固体,仍是发电、水泥製造和钢铁生产等产业的主要燃料来源。它的高热值和成本效益使其成为比传统燃料更受欢迎的选择。然而,日益增长的环境问题和监管压力促使各行各业探索替代能源。由于煤炭对环境产生不利影响,尤其是高碳和高硫排放,世界各国政府正在实施严格的政策来限制煤炭的使用。这种转变促使企业采用更干净的替代方案或实施先进的排放控制技术来继续使用石油焦。
炼油能力的不断扩大是石油焦供应不断增加的关键因素。随着越来越多的原油被提炼,作为重油加工的副产品,石油焦的产量也随之增加。此外,水泥和钢铁业的稳定需求进一步推动了市场成长。这些产业依赖石油焦,因为其价格低廉且能量输出高,确保了对该材料的持续需求。
| 市场范围 | |
|---|---|
| 起始年份 | 2024 |
| 预测年份 | 2025-2034 |
| 起始值 | 221亿美元 |
| 预测值 | 392亿美元 |
| 复合年增长率 | 5.9% |
石油焦市场分为燃料级石油焦和煅烧石油焦。燃料级石油焦因其在水泥厂、发电厂和钢铁生产设施中的广泛使用而占据主导地位。儘管人们对其高硫和高金属含量感到担忧,但它仍然是一种经济有效的煤炭替代品。
按应用细分的市场包括发电厂、水泥、钢铁和铝业等。 2024年,发电厂产业占石油焦市场总量的19.7%以上,凸显其在能源生产中的关键角色。火力发电厂继续依赖石油焦,特别是在难以获得清洁燃料的地区。
美国石油焦市场经历了显着成长,2022 年估值为 80 亿美元,2023 年为 82 亿美元,2024 年为 84 亿美元。不断扩张的钢铁和电力产业推动了这一需求,利用了石油焦的经济优势、高能量产量以及作为高炉碳源的角色。 2024年,美国的消费量将达到5,440万公吨,主要用于工业应用。与天然气和煤炭相比,石油焦的成本效益仍然是支撑其持续需求的关键因素。
目录
第一章:方法论与范围
第二章:执行摘要
第三章:行业洞察
- 产业生态系统分析
- 监管格局
- 产业衝击力
- 成长动力
- 产业陷阱与挑战
- 成长潜力分析
- 波特的分析
- PESTEL分析
第四章:竞争格局
- 介绍
- 战略仪表板
- 创新与技术格局
第五章:市场规模及预测:依等级,2021 - 2034
- 主要趋势
- 燃料等级
- 煅烧石油焦
第六章:市场规模及预测:依实物形态,2021 - 2034
- 主要趋势
- 海绵焦炭
- 清除焦炭
- 可乐
- 针状焦
第七章:市场规模及预测:依应用,2021 - 2034
- 主要趋势
- 发电厂
- 水泥业
- 钢铁业
- 铝工业
- 其他的
第八章:市场规模及预测:按地区,2021 - 2034
- 主要趋势
- 北美洲
- 我们
- 加拿大
- 欧洲
- 英国
- 德国
- 法国
- 希腊
- 俄罗斯
- 西班牙
- 亚太地区
- 中国
- 印度
- 日本
- 澳洲
- 中东和非洲
- 沙乌地阿拉伯
- 土耳其
- 科威特
- 拉丁美洲
- 巴西
- 阿根廷
- 智利
- 墨西哥
第九章:公司简介
- BP
- Chevron Corporation
- Exxon Mobil
- HF Sinclair Corporation
- Husky Energy
- Marathon Petroleum Corporation
- Oxbow Corporation
- Phillips 66 Company
- Reliance Industries
- Saudi Aramco
- Shell plc
- Valero Energy Corp
- Indian Oil Corporation
- Rosneft
- TotalEnergies
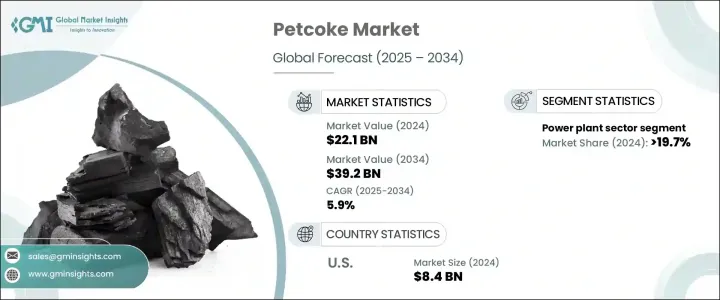
The Global Petcoke Market was valued at USD 22.1 billion in 2024 and is projected to expand at a CAGR of 5.9% from 2025 to 2034. Petcoke, a carbon-rich solid derived from oil refining, remains a key fuel source for industries such as power generation, cement manufacturing, and steel production. Its high calorific value and cost-effectiveness make it a preferred choice over conventional fuels. However, rising environmental concerns and regulatory pressures are prompting industries to explore alternative energy sources. Governments worldwide are implementing stringent policies to curb coal usage due to its adverse environmental impact, particularly high carbon and sulfur emissions. This shift is pushing companies to either adopt cleaner alternatives or implement advanced emission control technologies to continue using petcoke.
The increasing expansion of refinery capacities is a crucial factor contributing to the growing availability of petcoke. As more crude oil is refined, higher volumes of petcoke are produced as a byproduct of processing heavy oil. Additionally, the steady demand from cement and steel industries further propels market growth. These industries rely on petcoke for its affordability and high energy output, ensuring a consistent demand for the material.
| Market Scope | |
|---|---|
| Start Year | 2024 |
| Forecast Year | 2025-2034 |
| Start Value | $22.1 Billion |
| Forecast Value | $39.2 Billion |
| CAGR | 5.9% |
The petcoke market is segmented into fuel-grade and calcined petcoke. Fuel-grade petcoke holds a dominant share due to its widespread use in cement plants, power stations, and steel production facilities. It remains a cost-effective alternative to coal despite concerns regarding its high sulfur and metal content.
Market segmentation by application includes power plants, cement, steel, and aluminum industries, among others. In 2024, the power plant sector accounted for over 19.7% of the total petcoke market share, highlighting its critical role in energy production. Thermal power plants continue to rely on petcoke, especially in regions where cleaner fuels are not readily accessible.
The U.S. petcoke market has experienced notable growth, with valuations of USD 8 billion in 2022, USD 8.2 billion in 2023, and USD 8.4 billion in 2024. The expanding steel and power industries drive this demand, capitalizing on petcoke's economic advantages, high energy yield, and role as a carbon source in blast furnaces. In 2024, U.S. consumption reached 54.4 million metric tonnes, primarily for these industrial applications. The cost-efficiency of petcoke compared to natural gas and coal remains a key factor supporting its sustained demand.
Table of Contents
Chapter 1 Methodology & Scope
- 1.1 Market definitions
- 1.2 Base estimates & calculations
- 1.3 Forecast calculation
- 1.4 Data sources
- 1.4.1 Primary
- 1.4.2 Secondary
- 1.4.2.1 Paid
- 1.4.2.2 Public
Chapter 2 Executive Summary
- 2.1 Industry synopsis, 2021 - 2034
Chapter 3 Industry Insights
- 3.1 Industry ecosystem analysis
- 3.2 Regulatory landscape
- 3.3 Industry impact forces
- 3.3.1 Growth drivers
- 3.3.2 Industry pitfalls & challenges
- 3.4 Growth potential analysis
- 3.5 Porter's analysis
- 3.5.1 Bargaining power of suppliers
- 3.5.2 Bargaining power of buyers
- 3.5.3 Threat of new entrants
- 3.5.4 Threat of substitutes
- 3.6 PESTEL analysis
Chapter 4 Competitive landscape, 2024
- 4.1 Introduction
- 4.2 Strategic dashboard
- 4.3 Innovation & technology landscape
Chapter 5 Market Size and Forecast, By Grade, 2021 - 2034 (MT, USD Million)
- 5.1 Key trends
- 5.2 Fuel grade
- 5.3 Calcined petcoke
Chapter 6 Market Size and Forecast, By Physical Form, 2021 - 2034 (MT, USD Million)
- 6.1 Key trends
- 6.2 Sponge coke
- 6.3 Purge coke
- 6.4 Shot coke
- 6.5 Needle coke
Chapter 7 Market Size and Forecast, By Application, 2021 - 2034 (MT, USD Million)
- 7.1 Key trends
- 7.2 Power plants
- 7.3 Cement industry
- 7.4 Steel industry
- 7.5 Aluminum industry
- 7.6 Others
Chapter 8 Market Size and Forecast, By Region, 2021 - 2034 (MT, USD Million)
- 8.1 Key trends
- 8.2 North America
- 8.2.1 U.S.
- 8.2.2 Canada
- 8.3 Europe
- 8.3.1 UK
- 8.3.2 Germany
- 8.3.3 France
- 8.3.4 Greece
- 8.3.5 Russia
- 8.3.6 Spain
- 8.4 Asia Pacific
- 8.4.1 China
- 8.4.2 India
- 8.4.3 Japan
- 8.4.4 Australia
- 8.5 Middle East & Africa
- 8.5.1 Saudi Arabia
- 8.5.2 Turkey
- 8.5.3 Kuwait
- 8.6 Latin America
- 8.6.1 Brazil
- 8.6.2 Argentina
- 8.6.3 Chile
- 8.6.4 Mexico
Chapter 9 Company Profiles
- 9.1 BP
- 9.2 Chevron Corporation
- 9.3 Exxon Mobil
- 9.4 HF Sinclair Corporation
- 9.5 Husky Energy
- 9.6 Marathon Petroleum Corporation
- 9.7 Oxbow Corporation
- 9.8 Phillips 66 Company
- 9.9 Reliance Industries
- 9.10 Saudi Aramco
- 9.11 Shell plc
- 9.12 Valero Energy Corp
- 9.13 Indian Oil Corporation
- 9.14 Rosneft
- 9.15 TotalEnergies
 绿石油焦和锻烧石油焦:市场份额分析、行业趋势和统计数据、成长预测(2026-2031)
 石油焦市场-全球产业规模、份额、趋势、机会和预测,按类型、应用、地区和竞争格局划分,2020-2030年预测
 全球煅烧石油焦市场按应用、最终用户、产品类型、纯度等级和分销管道划分-2025-2032年预测石油焦市场按产品类型、形态、硫含量、应用、最终用户产业和分销管道划分 - 2025-2030 年全球预测
 2025年石油焦全球市场报告
 2025-2029年全球生焦与煅烧石油焦市场
 锻烧石油焦的全球市场
 石油焦的全球市场:各等级,各用途,各地区,机会,预测,2018年~2032年
 全球绿色石油焦市场规模(按类型、来源、最终用途、地区和预测)2026-2032 年石油焦市场:按类型、应用和地区划分