


 |
市场调查报告书
商品编码
1716530
营养棒市场机会、成长动力、产业趋势分析及 2025 - 2034 年预测Nutritional Bars Market Opportunity, Growth Drivers, Industry Trend Analysis, and Forecast 2025 - 2034 |
||||||
2024 年,全球营养棒市场规模达到 74 亿美元,预计 2025 年至 2034 年期间的复合年增长率将达到 6.1%,这得益于对更健康、方便携带的零食选择的需求激增。随着人们越来越关注健身、健康和均衡的生活方式,消费者正在积极寻求既能提供功能性益处又不影响口味的方便点心。随着全球健康意识的增强,人们开始将营养棒作为传统高热量零食和加工食品的理想替代品。人们对富含蛋白质、低糖、无麸质和有机产品的偏好日益增加,重新定义了消费者的期望,并鼓励品牌推出符合不断变化的饮食需求的创新产品。
现代消费者也密切关注成分透明度、永续性和道德采购,促使品牌采用可识别的天然成分的清洁标籤配方。此外,电子商务的日益普及,加上超市、便利商店和健身中心等场所产品的便利供应,持续推动营养棒的销售。随着城市人口生活节奏加快并重视整体健康,营养棒已成为寻求便携式营养的消费者的必需品,无论是运动前补充能量、代餐还是忙碌日程中的快餐。
| 市场范围 | |
|---|---|
| 起始年份 | 2024 |
| 预测年份 | 2025-2034 |
| 起始值 | 74亿美元 |
| 预测值 | 132亿美元 |
| 复合年增长率 | 6.1% |
市场分为各种类型的营养棒,包括谷物/燕麦棒、蛋白质棒、能量棒/代餐棒、水果和坚果棒等。其中,谷物棒和燕麦棒占据主导地位,因为它们作为健康、富含纤维且能提供持续能量的零食而广受欢迎。随着越来越多的消费者选择对自己更有益的食物,对低糖、高蛋白和有机谷物和燕麦棒的需求正在增长。各大品牌纷纷推出富含益生菌、胶原蛋白和适应原等功能性成分的产品,以满足人们对健康配方日益增长的兴趣。尤其是蛋白质棒,越来越受到健身爱好者、运动员以及寻求肌肉恢復或体重管理支持的个人的需求。随着消费者对食材的了解越来越深入,他们越来越倾向于选择那些提供纯净营养、不含人工添加剂和防腐剂的能量棒。
市场也分为无麸质和传统两大类。由于广泛的可及性和可负担性,传统酒吧目前占据了 62.1% 的市场份额。然而,随着人们对乳糜泻、麸质不耐症和谷物替代品益处的认识不断提高,无麸质营养棒正在迅速受到关注。製造商对此作出了回应,他们生产出含有藜麦、苋菜和荞麦等营养丰富的谷物的能量棒,以吸引对麸质敏感的消费者和注重健康的消费者。然而,开发平衡口味、质地和成本效益的无麸质棒仍然是一个挑战,迫使品牌投资研发。
美国营养棒市场占全球份额的 28%,到 2024 年将达到 21 亿美元,这得益于消费者对富含蛋白质和功能性食品的兴趣日益浓厚。完善的健身文化,加上对有机、非基因改造和清洁标籤产品日益增长的需求,加强了美国市场的扩张。此外,政府提倡健康饮食的有利倡议,加上零售和电子商务平台的成长,支持了强劲的销售。然而,激烈的竞争和高昂的生产成本仍然是品牌实现差异化和维持获利能力所面临的严峻挑战。
目录
第一章:方法论与范围
第二章:执行摘要
第三章:行业洞察
- 产业生态系统分析
- 影响价值链的因素
- 利润率分析
- 中断
- 未来展望
- 製造商
- 经销商
- 供应商格局
- 利润率分析
- 重要新闻和倡议
- 监管格局
- 衝击力
- 成长动力
- 产业陷阱与挑战
- 成长潜力分析
- 波特的分析
- PESTEL分析
第四章:竞争格局
- 介绍
- 公司市占率分析
- 竞争定位矩阵
- 战略展望矩阵
第五章:市场估计与预测:按产品,2021 年至 2034 年
- 主要趋势
- 谷物/格兰诺拉麦片棒
- 蛋白质棒
- 能量棒/代餐棒
- 水果和坚果棒
- 其他(减肥棒、碳水化合物棒、耐力棒)
第六章:市场估计与预测:依类别,2021 年至 2034 年
- 主要趋势
- 不含麸质
- 传统的
第七章:市场估计与预测:按配销通路,2021 年至 2034 年
- 主要趋势
- 大卖场/超市
- 专卖店
- 网路零售
- 其他的
第八章:市场估计与预测:按地区,2021 年至 2034 年
- 主要趋势
- 北美洲
- 我们
- 加拿大
- 欧洲
- 德国
- 英国
- 法国
- 西班牙
- 义大利
- 俄罗斯
- 亚太地区
- 中国
- 印度
- 日本
- 澳洲
- 韩国
- 拉丁美洲
- 巴西
- 墨西哥
- 中东和非洲
- 沙乌地阿拉伯
- 南非
- 阿联酋
第九章:公司简介
- General Mills Inc
- Ajinomoto Co Inc
- Cargill Incorporated
- Mondelez International
- Glanbia Plc
- HEALTHY BARS
- ADM
- Global Nutrition International
- The Simply Good Foods Company
- The Kellogg Company.
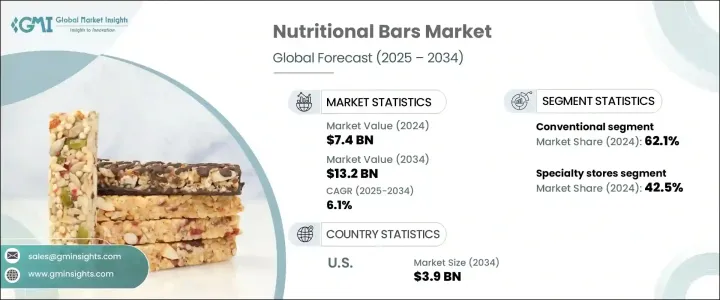
The Global Nutritional Bars Market reached USD 7.4 billion in 2024 and is projected to expand at a CAGR of 6.1% between 2025 and 2034, driven by the surging demand for healthier, on-the-go snacking options. With the rising focus on fitness, wellness, and balanced lifestyles, consumers are actively seeking convenient snacks that offer functional benefits without compromising on taste. As health awareness grows globally, people are turning to nutritional bars as an ideal alternative to traditional high-calorie snacks and processed foods. The increasing preference for protein-rich, low-sugar, gluten-free, and organic products has redefined consumer expectations, encouraging brands to deliver innovative products that align with evolving dietary needs.
Modern consumers are also paying close attention to ingredient transparency, sustainability, and ethical sourcing, prompting brands to adopt clean-label formulations with recognizable, natural ingredients. Moreover, the growing penetration of e-commerce, coupled with easy product availability in supermarkets, convenience stores, and fitness centers, continues to fuel sales of nutritional bars. As urban populations adopt fast-paced routines and prioritize holistic health, nutritional bars have emerged as a staple for consumers seeking portable nutrition, whether for pre-workout energy, meal replacement, or quick snacks during busy schedules.
| Market Scope | |
|---|---|
| Start Year | 2024 |
| Forecast Year | 2025-2034 |
| Start Value | $7.4 Billion |
| Forecast Value | $13.2 Billion |
| CAGR | 6.1% |
The market is segmented into various types of nutritional bars, including cereal/granola bars, protein bars, energy bars/meal replacement bars, fruit and nut bars, and others. Among these, cereal and granola bars dominate due to their widespread appeal as wholesome, fiber-rich snacks that provide sustained energy. As more consumers opt for better-for-you options, demand for low-sugar, high-protein, and organic variants of cereal and granola bars is gaining momentum. Brands are launching products enriched with functional ingredients like probiotics, collagen, and adaptogens to meet the rising interest in health-boosting formulations. Protein bars, in particular, are seeing heightened demand from fitness enthusiasts, athletes, and individuals seeking muscle recovery or weight management support. With consumers becoming increasingly ingredient-savvy, there is a strong preference for bars that offer clean nutrition, free from artificial additives and preservatives.
The market is also categorized into gluten-free and conventional segments. Conventional bars currently command a significant 62.1% market share, driven by broad accessibility and affordability. However, gluten-free nutritional bars are rapidly gaining traction as awareness about celiac disease, gluten intolerance, and the benefits of grain alternatives rises. Manufacturers are responding by formulating bars with nutrient-dense grains such as quinoa, amaranth, and buckwheat, which appeal to both gluten-sensitive and general health-conscious consumers. Yet, the development of gluten-free bars that balance taste, texture, and cost-effectiveness continues to be a challenge, pushing brands to invest in R&D.
U.S. Nutritional Bars Market accounted for 28% of the global share, generating USD 2.1 billion in 2024, propelled by growing consumer interest in protein-enriched and functional foods. A well-established fitness culture, coupled with heightened demand for organic, non-GMO, and clean-label products, reinforces market expansion in the U.S. Moreover, favorable government initiatives promoting healthy eating, combined with the growth of retail and e-commerce platforms, support robust sales. Nevertheless, fierce competition and high production costs remain critical challenges for brands aiming to differentiate and sustain profitability.
Table of Contents
Chapter 1 Methodology & Scope
- 1.1 Market scope & definition
- 1.2 Base estimates & calculations
- 1.3 Forecast calculation
- 1.4 Data sources
- 1.4.1 Primary
- 1.4.2 Secondary
- 1.4.2.1 Paid sources
- 1.4.2.2 Public sources
- 1.5 Primary research and validation
- 1.5.1 Primary sources
- 1.5.2 Data mining sources
Chapter 2 Executive Summary
- 2.1 Industry synopsis, 2021-2034
Chapter 3 Industry Insights
- 3.1 Industry ecosystem analysis
- 3.1.1 Factor affecting the value chain
- 3.1.2 Profit margin analysis
- 3.1.3 Disruptions
- 3.1.4 Future outlook
- 3.1.5 Manufacturers
- 3.1.6 Distributors
- 3.2 Supplier landscape
- 3.3 Profit margin analysis
- 3.4 Key news & initiatives
- 3.5 Regulatory landscape
- 3.6 Impact forces
- 3.6.1 Growth drivers
- 3.6.2 Industry pitfalls & challenges
- 3.7 Growth potential analysis
- 3.8 Porter's analysis
- 3.9 PESTEL analysis
Chapter 4 Competitive Landscape, 2024
- 4.1 Introduction
- 4.2 Company market share analysis
- 4.3 Competitive positioning matrix
- 4.4 Strategic outlook matrix
Chapter 5 Market Estimates and Forecast, By Product, 2021 – 2034 (USD Billion) (Kilo Tons)
- 5.1 Key trends
- 5.2 Cereal/Granola bars
- 5.3 Protein bars
- 5.4 Energy Bars/ Meal replacements bars
- 5.5 Fruits & nuts bars
- 5.6 Others (Diet Bars, Carbohydrate Bars, Endurance bars)
Chapter 6 Market Estimates and Forecast, By Category, 2021 – 2034 (USD Billion) (Kilo Tons)
- 6.1 Key trends
- 6.2 Gluten-free
- 6.3 Conventional
Chapter 7 Market Estimates and Forecast, By Distribution Channel, 2021 – 2034 (USD Billion) (Kilo Tons)
- 7.1 Key trends
- 7.2 Hypermarkets/Supermarkets
- 7.3 Specialty stores
- 7.4 Online retail
- 7.5 Others
Chapter 8 Market Estimates and Forecast, By Region, 2021 – 2034 (USD Billion) (Kilo Tons)
- 8.1 Key trends
- 8.2 North America
- 8.2.1 U.S.
- 8.2.2 Canada
- 8.3 Europe
- 8.3.1 Germany
- 8.3.2 UK
- 8.3.3 France
- 8.3.4 Spain
- 8.3.5 Italy
- 8.3.6 Russia
- 8.4 Asia Pacific
- 8.4.1 China
- 8.4.2 India
- 8.4.3 Japan
- 8.4.4 Australia
- 8.4.5 South Korea
- 8.5 Latin America
- 8.5.1 Brazil
- 8.5.2 Mexico
- 8.6 Middle East and Africa
- 8.6.1 Saudi Arabia
- 8.6.2 South Africa
- 8.6.3 UAE
Chapter 9 Company Profiles
- 9.1 General Mills Inc
- 9.2 Ajinomoto Co Inc
- 9.3 Cargill Incorporated
- 9.4 Mondelez International
- 9.5 Glanbia Plc
- 9.6 HEALTHY BARS
- 9.7 ADM
- 9.8 Global Nutrition International
- 9.9 The Simply Good Foods Company
- 9.10 The Kellogg Company.

