


 |
市场调查报告书
商品编码
1716548
光纤预製棒市场机会、成长动力、产业趋势分析及 2025 - 2034 年预测Fiber Optic Preform Market Opportunity, Growth Drivers, Industry Trend Analysis, and Forecast 2025 - 2034 |
||||||
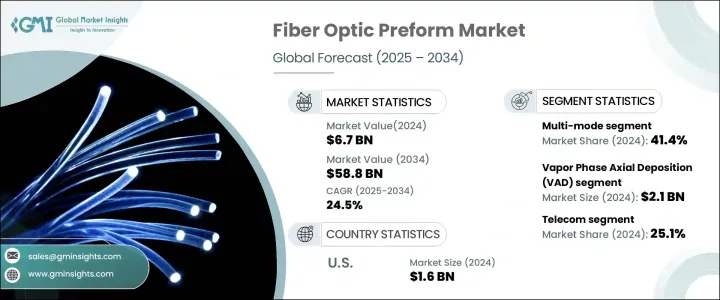
2024 年全球光纤预製棒市场规模达 67 亿美元,预估 2025-2034 年期间复合年增长率为 24.5%。这一显着增长得益于高速互联网的日益普及,这得益于 5G 网路的推出以及对更快、更可靠的资料传输的需求不断增长。随着现代数位基础设施对企业和家庭变得至关重要,光纤预製棒在提高网路容量和效能方面发挥关键作用。这些预製件对于製造能够实现无缝通讯、云端运算以及人工智慧 (AI) 和物联网 (IoT) 等先进技术的光纤电缆至关重要。
随着世界各国致力于改善数位连接,政府措施和对光纤基础设施的大量投资进一步加速了市场扩张。此外,超大规模和边缘资料中心的激增凸显了对先进光纤解决方案的需求,以支援不断增长的资料流量。人们对能够处理视讯串流、线上游戏和云端服务等资料密集型应用程式激增的大容量网路的偏好日益增加,进一步增强了市场的上升趋势。
| 市场范围 | |
|---|---|
| 起始年份 | 2024 |
| 预测年份 | 2025-2034 |
| 起始值 | 67亿美元 |
| 预测值 | 588亿美元 |
| 复合年增长率 | 24.5% |
市场按产品类型细分为单模、多模和其他类别。 2024年,多模式市场占有41.4%的份额。多模光纤非常适合短距离通信,支援100G、400G和800G等先进的乙太网路技术。与单模光纤相比,它们在短距离应用中的成本效益使其成为企业实施区域网路 (LAN) 和储存区域网路 (SAN) 的首选。多模光纤也因其能够在较短距离内有效处理高资料传输速率而闻名,这使得它们对于企业网路来说不可或缺。
根据工艺,光纤预製棒市场分为改进化学气相沉积 (MCVD)、气相轴向沉积 (VAD)、外部气相沉积 (OVD) 和等离子体活化化学气相沉积 (PCVD)。 2024 年,VAD 製程创造了 21 亿美元的产值。 VAD 因其能够生产品质稳定的长而连续的预製棒,被广泛应用于大规模生产环境中。这种方法使製造商能够大量生产光纤电缆,同时保持高精度,满足全球日益增长的光纤解决方案需求。
2024 年美国光纤预製棒市场产值将达到 16 亿美元,反映出对大容量网路的需求不断增长以及对数位基础设施的投资不断增加。云端运算和人工智慧的快速成长带动了资料中心的扩张,对可靠的光纤解决方案提出了更高的需求。各大电信公司正大力投资光纤基础设施,以满足对更快、更可靠的连接日益增长的需求。随着消费者和企业都寻求提高资料传输能力,光纤预製棒仍然是加强国家数位基础设施不可或缺的一部分。
目录
第一章:方法论与范围
第二章:执行摘要
第三章:行业洞察
- 产业生态系统分析
- 影响价值链的因素
- 利润率分析
- 中断
- 未来展望
- 製造商
- 经销商
- 供应商格局
- 利润率分析
- 重要新闻和倡议
- 监管格局
- 衝击力
- 成长动力
- 5G网路的快速普及
- 有利的政府措施和投资
- 高速网路需求增加
- 海底电缆部署日益增多
- 光纤技术的进步
- 产业陷阱与挑战
- 生产成本高
- 原物料价格波动
- 成长动力
- 成长潜力分析
- 波特的分析
- PESTEL分析
第四章:竞争格局
- 介绍
- 公司市占率分析
- 竞争定位矩阵
- 战略展望矩阵
第五章:市场估计与预测:依产品类型,2021-2034
- 主要趋势
- 单模
- 多模式
- 其他的
第六章:市场估计与预测:依工艺,2021-2034
- 主要趋势
- 气相轴向沉积 (VAD)
- 改良的化学气相沉积(MCVD)
- 外部气相沉积(OVD)
- 等离子活化化学气相沉积(PCVD)
第七章:市场估计与预测:按最终用途产业,2021-2034 年
- 主要趋势
- 电信
- 石油和天然气
- 军事和航太
- 金融服务业
- 医疗的
- 铁路
- 其他的
第八章:市场估计与预测:按地区,2021-2034
- 主要趋势
- 北美洲
- 我们
- 加拿大
- 欧洲
- 英国
- 德国
- 法国
- 义大利
- 西班牙
- 俄罗斯
- 亚太地区
- 中国
- 印度
- 日本
- 韩国
- 澳洲
- 拉丁美洲
- 巴西
- 墨西哥
- MEA
- 南非
- 沙乌地阿拉伯
- 阿联酋
第九章:公司简介
- Corning Incorporated
- Fasten Group
- FCJ OPTO TECH
- Fujikura Ltd.
- Futong Group
- Hengtong Group
- Heraeus Holding GmbH
- Jiangsu Zhongtian Technology Co., Ltd.
- OFS Fitel, LLC
- Prysmian Group
- Rosendahl Nextrom GmbH
- Shin-Etsu Chemical Co., Ltd
- Sterlite Technologies Limited
- Sumitomo Electric Industries, Ltd
- Yangtze Optical Fibre (YOFC)
The Global Fiber Optic Preform Market generated USD 6.7 billion in 2024 and is expected to expand at a CAGR of 24.5% during 2025-2034. This remarkable growth is fueled by the increasing adoption of high-speed internet, driven by the rollout of 5G networks and rising demand for faster and more reliable data transmission. As modern digital infrastructure becomes essential for both businesses and households, fiber optic preforms play a pivotal role in enhancing network capacity and performance. These preforms are vital in creating fiber optic cables that enable seamless communication, cloud computing, and advanced technologies such as artificial intelligence (AI) and the Internet of Things (IoT).
Government initiatives and substantial investments in fiber infrastructure further accelerate market expansion, as countries worldwide focus on improving digital connectivity. Additionally, the proliferation of data centers, both hyperscale and edge-based, highlights the need for advanced fiber optic solutions to support the growing volume of data traffic. The increasing preference for high-capacity networks that can handle the surge in data-intensive applications, including video streaming, online gaming, and cloud services, further strengthens the market's upward trajectory.
| Market Scope | |
|---|---|
| Start Year | 2024 |
| Forecast Year | 2025-2034 |
| Start Value | $6.7 Billion |
| Forecast Value | $58.8 Billion |
| CAGR | 24.5% |
The market is segmented by product type into single-mode, multi-mode, and other categories. In 2024, the multi-mode segment held 41.4% of the market share. Multi-mode fibers are well-suited for short-distance communication, supporting advanced Ethernet technologies such as 100G, 400G, and 800G. Their cost-effectiveness in short-range applications, compared to single-mode fibers, makes them the preferred choice for businesses implementing Local Area Networks (LAN) and Storage Area Networks (SAN). Multi-mode fibers are also known for their ability to handle high data transmission rates efficiently over shorter distances, making them indispensable for enterprise networks.
By process, the fiber optic preform market is divided into Modified Chemical Vapor Deposition (MCVD), Vapor Phase Axial Deposition (VAD), Outside Vapor Deposition (OVD), and Plasma Activated Chemical Vapor Deposition (PCVD). The VAD process generated USD 2.1 billion in 2024. VAD is widely adopted in mass production environments due to its ability to produce long, continuous preforms with consistent quality. This method enables manufacturers to produce fiber optic cables in large quantities while maintaining high precision, meeting the increasing global demand for fiber optic solutions.
The U.S. fiber optic preform market generated USD 1.6 billion in 2024, reflecting the rising demand for high-capacity networks and increased investment in digital infrastructure. The rapid growth of cloud computing and AI has led to the expansion of data centers, creating a higher demand for reliable fiber optic solutions. Major telecommunications companies are investing heavily in fiber infrastructure to meet the growing need for faster and more reliable connectivity. As both consumers and businesses seek improved data transmission capabilities, fiber optic preforms remain an integral component in strengthening the country's digital infrastructure.
Table of Contents
Chapter 1 Methodology & Scope
- 1.1 Market scope & definitions
- 1.2 Base estimates & calculations
- 1.3 Forecast calculations
- 1.4 Data sources
- 1.4.1 Primary
- 1.4.2 Secondary
- 1.4.2.1 Paid sources
- 1.4.2.2 Public sources
Chapter 2 Executive Summary
- 2.1 Industry synopsis, 2021-2034
Chapter 3 Industry Insights
- 3.1 Industry ecosystem analysis
- 3.1.1 Factor affecting the value chain
- 3.1.2 Profit margin analysis
- 3.1.3 Disruptions
- 3.1.4 Future outlook
- 3.1.5 Manufacturers
- 3.1.6 Distributors
- 3.2 Supplier landscape
- 3.3 Profit margin analysis
- 3.4 Key news & initiatives
- 3.5 Regulatory landscape
- 3.6 Impact forces
- 3.6.1 Growth drivers
- 3.6.1.1 Rapid proliferation of 5G networks
- 3.6.1.2 Favorable government initiatives and investments
- 3.6.1.3 Increase in demand for high-speed internet
- 3.6.1.4 Growing deployment of submarine cable
- 3.6.1.5 Rise in advancements in fiber optic technology
- 3.6.2 Industry pitfalls & challenges
- 3.6.2.1 High production costs
- 3.6.2.2 Fluctuating raw material prices
- 3.6.1 Growth drivers
- 3.7 Growth potential analysis
- 3.8 Porter's analysis
- 3.9 PESTEL analysis
Chapter 4 Competitive Landscape, 2024
- 4.1 Introduction
- 4.2 Company market share analysis
- 4.3 Competitive positioning matrix
- 4.4 Strategic outlook matrix
Chapter 5 Market Estimates & Forecast, By Product Type, 2021-2034 (USD Billion)
- 5.1 Key trends
- 5.2 Single-Mode
- 5.3 Multi-Mode
- 5.4 Others
Chapter 6 Market Estimates & Forecast, By Process, 2021-2034 (USD Billion)
- 6.1 Key trends
- 6.2 Vapor Phase Axial Deposition (VAD)
- 6.3 Modified Chemical Vapor Deposition (MCVD)
- 6.4 Outside Vapor Deposition (OVD)
- 6.5 Plasma Activated Chemical Vapor Deposition (PCVD)
Chapter 7 Market Estimates & Forecast, By End Use Industry, 2021-2034 (USD Billion)
- 7.1 Key trends
- 7.2 Telecom
- 7.3 Oil & gas
- 7.4 Military & aerospace
- 7.5 BFSI
- 7.6 Medical
- 7.7 Railway
- 7.8 Others
Chapter 8 Market Estimates & Forecast, By Region, 2021-2034 (USD Billion)
- 8.1 Key trends
- 8.2 North America
- 8.2.1 U.S.
- 8.2.2 Canada
- 8.3 Europe
- 8.3.1 UK
- 8.3.2 Germany
- 8.3.3 France
- 8.3.4 Italy
- 8.3.5 Spain
- 8.3.6 Russia
- 8.4 Asia Pacific
- 8.4.1 China
- 8.4.2 India
- 8.4.3 Japan
- 8.4.4 South Korea
- 8.4.5 Australia
- 8.5 Latin America
- 8.5.1 Brazil
- 8.5.2 Mexico
- 8.6 MEA
- 8.6.1 South Africa
- 8.6.2 Saudi Arabia
- 8.6.3 UAE
Chapter 9 Company Profiles
- 9.1 Corning Incorporated
- 9.2 Fasten Group
- 9.3 FCJ OPTO TECH
- 9.4 Fujikura Ltd.
- 9.5 Futong Group
- 9.6 Hengtong Group
- 9.7 Heraeus Holding GmbH
- 9.8 Jiangsu Zhongtian Technology Co., Ltd.
- 9.9 OFS Fitel, LLC
- 9.10 Prysmian Group
- 9.11 Rosendahl Nextrom GmbH
- 9.12 Shin-Etsu Chemical Co., Ltd
- 9.13 Sterlite Technologies Limited
- 9.14 Sumitomo Electric Industries, Ltd
- 9.15 Yangtze Optical Fibre (YOFC)
 光纤预製棒市场 - 全球产业规模、份额、趋势、机会、预测:按工艺、产品类型、最终用户、地区和竞争格局划分,2021-2031年
 光纤预型体:全球市场份额和排名、总收入和需求预测(2025-2031 年)
 光纤预製棒市场,按产品类型、按工艺、按最终用途行业、按国家和地区 - 2025 年至 2032 年全球行业分析、市场规模、市场份额及预测
 2030 年光纤预製棒市场预测:按产品类型、製程、最终用户和地区分類的全球分析
 全球光纤预製棒市场 2024-2031
 光纤预製棒市场,占有率,规模,趋势,行业分析报告:依工艺、依产品类型、依最终用户、依地区、依细分市场、预测,2024-2032 年