


 |
市场调查报告书
商品编码
1716558
冷藏自动贩卖机市场机会、成长动力、产业趋势分析及 2025 - 2034 年预测Refrigerated Vending Machine Market Opportunity, Growth Drivers, Industry Trend Analysis, and Forecast 2025 - 2034 |
||||||
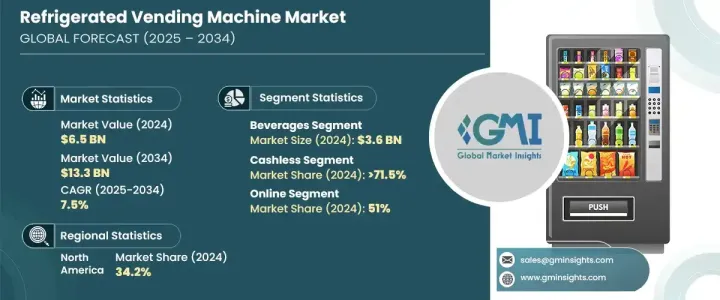
2024 年全球冷藏自动贩卖机市场价值为 65 亿美元,预计 2025 年至 2034 年的复合年增长率为 7.5%。这一增长主要得益于对冷冻食品、冷藏饮料和易腐烂产品的需求不断增长,而这得益于人们生活方式的改变和对方便、即食食品的日益增长的偏好。随着城市化和繁忙的工作日程不断影响消费者偏好,越来越多的人选择冷冻食品、乳製品、冰淇淋和新鲜零食,冷藏自动贩卖机成为满足这些需求的理想解决方案。
多区域冷却、即时监控和节能冷却系统等技术进步有助于维持产品的新鲜度和安全性,同时降低营运成本。根据美国能源部的数据,这些系统可以减少高达 30% 的能源消耗,对于旨在优化性能和降低成本的企业来说,它们是一个有吸引力的选择。随着自助零售和自动便利商店的日益普及,冷藏自动贩卖机在机场、医院、办公室和公共交通站等地提供新鲜和冷冻食品选择,进一步推动了市场的发展。
| 市场范围 | |
|---|---|
| 起始年份 | 2024 |
| 预测年份 | 2025-2034 |
| 起始值 | 65亿美元 |
| 预测值 | 133亿美元 |
| 复合年增长率 | 7.5% |
2024 年,饮料业创造 36 亿美元的收入,预计在预测期内以 7.9% 的复合年增长率成长。瓶装水、软性饮料、冰咖啡和能量饮料的需求量很大,使得冷藏自动贩卖机成为忙碌消费者的首选。功能性饮料(例如调味水和健康饮料)的日益普及进一步刺激了这种需求。配备先进冷却系统和无现金支付选项的智慧自动贩卖机在学校、办公室、医院和机场等人流量大的区域越来越受欢迎,增强了自动贩卖机对于寻求快速便捷地获得冰镇饮料的消费者的吸引力。
2024 年,无现金支付领域占据了超过 71.5% 的市场份额,预计到 2034 年将以 9% 的速度成长。无现金支付系统的广泛采用透过提供安全且用户友好的选项简化了自动贩卖机交易。消费者越来越多地从现金转向行动钱包、信用卡/金融卡和非接触式支付。配备 NFC 扫描器和二维码阅读器的智慧自动贩卖机可实现无缝、安全的支付,满足日益增长的无现金便利需求。
受电子商务平台提供的便利性和多样性的推动,到 2024 年,线上配销通路将占据 51% 的主要份额。线上管道允许消费者在购买之前比较型号、查看产品规格并阅读客户评论。买家可以享受多种付款方式、轻鬆订购和直接送货上门服务,无需前往实体店。製造商还利用线上平台接触更广泛的客户群,并提供有关其产品的详细信息,从而促进线上销售日益普及。
2024 年,北美引领冷藏自动贩卖机市场,占全球市场份额的 34.2%,创造约 22 亿美元的收入。该地区的成长得益于快餐店和零售连锁店的广泛存在,对即食小吃和饮料的强劲需求。配备人工智慧库存管理和数位支付系统的智慧自动贩卖机的使用日益增多,进一步加强了市场扩张。政府倡议,例如美国能源部推广节能製冷技术的激励措施,也鼓励了产业的创新和采用。
目录
第一章:方法论与范围
第二章:执行摘要
第三章:行业洞察
- 产业生态系统分析
- 供应商格局
- 定价分析
- 技术与创新格局
- 重要新闻和倡议
- 监管格局
- 製造商
- 经销商
- 对部队的影响
- 成长动力
- 冷冻食品和冷藏产品的需求不断增长
- 生活方式的改变和快速的城市化
- 产业陷阱与挑战
- 安装和营运成本高
- 日益严格的监管
- 成长动力
- 成长潜力分析
- 波特的分析
- PESTEL分析
第四章:竞争格局
- 介绍
- 公司市占率分析
- 竞争定位矩阵
- 战略展望矩阵
第五章:市场估计与预测:按产品类型,2021 - 2034 年(十亿美元)
- 主要趋势
- 饮料
- 非酒精性
- 汽水
- 可乐
- 柠檬水
- 水果味汽水
- 热饮
- 水
- 其他(果汁等)
- 汽水
- 酒精
- 非酒精性
- 乳製品
- 新鲜水果和蔬菜
- 冷冻食品
- 其他(製药)
第六章:市场估计与预测:按营运模式,2021 - 2034 年(十亿美元)
- 主要趋势
- 聪明的
- 传统的
第七章:市场估计与预测:按支付方式,2021 - 2034 年(十亿美元)
- 主要趋势
- 现金
- 无现金
第八章:市场估计与预测:按最终用途,2021 - 2034 年(十亿美元)
- 主要趋势
- 食品服务
- 全方位服务的餐厅和饭店
- 速食店
- 其他(咖啡厅、酒吧)
- 零售
- 超市和超市
- 杂货
- 药局
- 其他(个体店、一元商店等)
- 其他(企业、博览会、地铁等)
第九章:市场估计与预测:按配销通路,2021 - 2034 年(十亿美元)
- 主要趋势
- 在线的
- 电子商务
- 公司网站
- 离线
第十章:市场估计与预测:按地区,2021 - 2034 年(十亿美元)
- 主要趋势
- 北美洲
- 我们
- 加拿大
- 欧洲
- 英国
- 德国
- 法国
- 义大利
- 西班牙
- 俄罗斯
- 亚太地区
- 中国
- 印度
- 日本
- 澳洲
- 韩国
- 拉丁美洲
- 巴西
- 墨西哥
- 阿根廷
- MEA
- 阿联酋
- 南非
- 沙乌地阿拉伯
第 11 章:公司简介
- Azkoyen
- Bharat Refrigerations
- Bianchi Vending
- Crane Merchandising
- Dover
- FAS International
- Fuji Electric
- Heatcraft Worldwide Refrigeration
- Rheavendors
- Rockwell Industries
- RS Hughes
- Seaga Manufacturing
- Vendcraftz
- Vendekin Technologies
- Westomatic Vending Services
The Global Refrigerated Vending Machine Market was valued at USD 6.5 billion in 2024 and is expected to grow at a CAGR of 7.5% from 2025 to 2034. This growth is largely driven by the increasing demand for frozen foods, chilled beverages, and perishable products, fueled by changing lifestyles and the growing preference for convenient, ready-to-eat options. As urbanization and busy work schedules continue to shape consumer preferences, more people are opting for frozen meals, dairy products, ice cream, and fresh snacks, making refrigerated vending machines an ideal solution to meet these needs.
Technological advancements such as multi-zone cooling, real-time monitoring, and energy-efficient refrigeration systems help maintain product freshness and safety while reducing operational costs. According to the U.S. Department of Energy, these systems can reduce energy consumption by up to 30%, making them an attractive option for businesses aiming to optimize performance and minimize expenses. The increasing adoption of self-service retail and automated convenience stores has further fueled the market as refrigerated vending machines offer fresh and frozen food options at locations like airports, hospitals, offices, and public transit stations.
| Market Scope | |
|---|---|
| Start Year | 2024 |
| Forecast Year | 2025-2034 |
| Start Value | $6.5 Billion |
| Forecast Value | $13.3 Billion |
| CAGR | 7.5% |
In 2024, the beverages segment generated USD 3.6 billion in revenue and is expected to grow at a CAGR of 7.9% during the forecast period. High demand for bottled water, soft drinks, iced coffee, and energy drinks has made refrigerated vending machines a preferred choice for on-the-go consumers. The increasing popularity of functional beverages, such as flavored water and health-boosting drinks, has further fueled this demand. Smart vending machines equipped with advanced cooling systems and cashless payment options have become increasingly popular in high-traffic areas such as schools, offices, hospitals, and airports, enhancing the appeal of vending machines for consumers seeking quick and convenient access to chilled beverages.
The cashless segment accounted for over 71.5% of the market in 2024 and is projected to grow at a rate of 9% through 2034. The widespread adoption of cashless payment systems has simplified vending machine transactions by offering secure and user-friendly options. Consumers are increasingly shifting from cash to mobile wallets, credit/debit cards, and contactless payments. Smart vending machines equipped with NFC scanners and QR code readers facilitate seamless and secure payments, catering to the growing demand for cashless convenience.
The online distribution channel held a major share of 51% in 2024, driven by the convenience and variety offered by e-commerce platforms. Online channels allow consumers to compare models, review product specifications, and read customer reviews before making a purchase. Buyers benefit from multiple payment options, easy ordering, and direct home delivery, eliminating the need to visit physical stores. Manufacturers also leverage online platforms to reach a broader customer base and provide detailed information about their products, contributing to the growing popularity of online sales.
North America led the refrigerated vending machine market in 2024, accounting for 34.2% of the global market share and generating approximately USD 2.2 billion in revenue. The region's growth is fueled by a strong demand for grab-and-go snacks and beverages, influenced by the widespread presence of fast-food restaurants and retail chains. The rising use of intelligent vending machines with AI-driven inventory management and digital payment systems has further strengthened market expansion. Government initiatives, such as incentives from the U.S. Department of Energy promoting energy-efficient refrigeration technologies, have also encouraged innovation and adoption within the industry.
Table of Contents
Chapter 1 Methodology & Scope
- 1.1 Research design
- 1.1.1 Research approach
- 1.1.2 Data collection methods
- 1.2 Base estimates and calculations
- 1.2.1 Base year calculation
- 1.2.2 Key trends for market estimates
- 1.3 Forecast model
- 1.4 Primary research & validation
- 1.4.1 Primary sources
- 1.4.2 Data mining sources
- 1.5 Market definitions
Chapter 2 Executive Summary
- 2.1 Industry synopsis, 2021 - 2034
Chapter 3 Industry Insights
- 3.1 Industry ecosystem analysis
- 3.2 Supplier landscape
- 3.3 Pricing analysis
- 3.4 Technology & innovation landscape
- 3.5 Key news & initiatives
- 3.6 Regulatory landscape
- 3.7 Manufacturers
- 3.8 Distributors
- 3.9 Impact on forces
- 3.9.1 Growth drivers
- 3.9.1.1 Rising demand of frozen foods and chilled products
- 3.9.1.2 Changing lifestyle and rapid urbanization
- 3.9.2 Industry pitfalls & challenges
- 3.9.2.1 High installation and operating costs
- 3.9.2.2 Rising stringent regulations
- 3.9.1 Growth drivers
- 3.10 Growth potential analysis
- 3.11 Porter's analysis
- 3.12 PESTEL analysis
Chapter 4 Competitive Landscape, 2024
- 4.1 Introduction
- 4.2 Company market share analysis
- 4.3 Competitive positioning matrix
- 4.4 Strategic outlook matrix
Chapter 5 Market Estimates & Forecast, By Product Type, 2021 - 2034 ($Bn) (Thousand Units)
- 5.1 Key trends
- 5.2 Beverages
- 5.2.1 Non-alcoholic
- 5.2.1.1 Soft drink
- 5.2.1.1.1 Cola
- 5.2.1.1.2 Lemonade
- 5.2.1.1.3 Fruit-flavored sodas
- 5.2.1.1.4 Hot beverages
- 5.2.1.2 Water
- 5.2.1.3 Others (Fruit Juices, etc.)
- 5.2.1.1 Soft drink
- 5.2.2 Alcoholic
- 5.2.1 Non-alcoholic
- 5.3 Dairy products
- 5.4 Fresh fruits and vegetables
- 5.5 Frozen foods
- 5.6 Others (Pharma)
Chapter 6 Market Estimates & Forecast, By Operation Mode, 2021 - 2034 ($Bn) (Thousand Units)
- 6.1 Key trends
- 6.2 Smart
- 6.3 Conventional
Chapter 7 Market Estimates & Forecast, By Payment Mode, 2021 - 2034 ($Bn) (Thousand Units)
- 7.1 Key trends
- 7.2 Cash
- 7.3 Cashless
Chapter 8 Market Estimates & Forecast, By End Use, 2021 - 2034 ($Bn) (Thousand Units)
- 8.1 Key trends
- 8.2 Food services
- 8.2.1 Full-Service Restaurants & Hotels
- 8.2.2 Quick service restaurants
- 8.2.3 Others (cafe, bars)
- 8.3 Retails
- 8.3.1 Supermarket & Supermarket
- 8.3.2 Groceries
- 8.3.3 Drug store
- 8.3.4 Others (Individual Stores, Dollar Stores, etc.)
- 8.4 Others (Corporates, Expo, metro, etc.)
Chapter 9 Market Estimates & Forecast, By Distribution Channel, 2021 - 2034 ($Bn) (Thousand Units)
- 9.1 Key trends
- 9.2 Online
- 9.2.1 E-commerce
- 9.2.2 Company website
- 9.3 Offline
Chapter 10 Market Estimates & Forecast, By Region, 2021 - 2034 ($Bn) (Thousand Units)
- 10.1 Key trends
- 10.2 North America
- 10.2.1 U.S.
- 10.2.2 Canada
- 10.3 Europe
- 10.3.1 UK
- 10.3.2 Germany
- 10.3.3 France
- 10.3.4 Italy
- 10.3.5 Spain
- 10.3.6 Russia
- 10.4 Asia Pacific
- 10.4.1 China
- 10.4.2 India
- 10.4.3 Japan
- 10.4.4 Australia
- 10.4.5 South Korea
- 10.5 Latin America
- 10.5.1 Brazil
- 10.5.2 Mexico
- 10.5.3 Argentina
- 10.6 MEA
- 10.6.1 UAE
- 10.6.2 South Africa
- 10.6.3 Saudi Arabia
Chapter 11 Company Profiles
- 11.1 Azkoyen
- 11.2 Bharat Refrigerations
- 11.3 Bianchi Vending
- 11.4 Crane Merchandising
- 11.5 Dover
- 11.6 FAS International
- 11.7 Fuji Electric
- 11.8 Heatcraft Worldwide Refrigeration
- 11.9 Rheavendors
- 11.10 Rockwell Industries
- 11.11 RS Hughes
- 11.12 Seaga Manufacturing
- 11.13 Vendcraftz
- 11.14 Vendekin Technologies
- 11.15 Westomatic Vending Services
 北美零售自动贩卖机市场:市场规模、份额和趋势分析(按产品、安装地点、支付方式和国家/地区划分),细分市场预测(2025-2033 年)
 自动贩卖机市场预测至2032年:按型号、技术、支付方式、应用和地区分類的全球分析2032 年智慧售货和自动零售市场预测:按机器类型、部署、分销管道、技术、最终用户和地区进行的全球分析
 按产品类型、付款方式、自动贩卖技术、地点和最终用户分類的零售自动贩卖机市场-2025-2032年全球预测按产品类型、支付方式、温度控制、安装位置、最终用户和分销管道分類的投币式自动贩卖机市场-2025年至2032年全球预测智慧型自动贩卖机市场按产品类型、组件、最终用户和分销管道划分-2025-2032年全球预测自动贩卖机市场按产品类型、技术、应用和支付方式划分-2025-2032年全球预测
 2025年全球自动贩卖机市场报告2025年全球零售自动贩卖机市场报告2025年全球自动贩卖机营运商市场报告