


 |
市场调查报告书
商品编码
1716577
工业锅炉市场机会、成长动力、产业趋势分析及2025-2034年预测Industrial Boiler Market Opportunity, Growth Drivers, Industry Trend Analysis, and Forecast 2025 - 2034 |
||||||
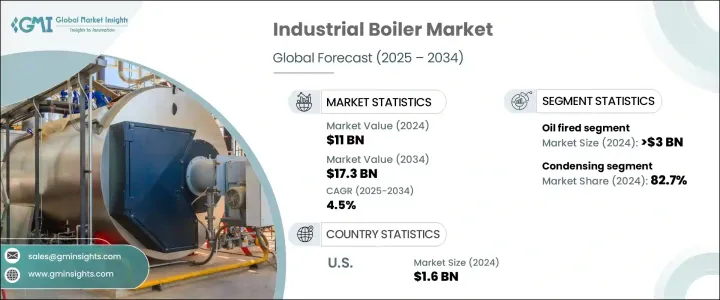
2024 年全球工业锅炉市场规模达 110 亿美元,预计 2025 年至 2034 年期间的复合年增长率为 4.5%。随着各行各业越来越注重永续性、能源效率以及遵守更严格的环境法规,市场正在稳步成长。随着气候变迁问题的日益严重,世界各国政府正在实施严格的氮氧化物 (NOx)、硫氧化物 (SOx) 和二氧化碳 (CO2) 等污染物排放标准。这些监管措施迫使工业设施采用更清洁、更有效率的锅炉技术,从而推动了各行业的巨大需求。此外,全球向再生能源的转变正在改变工业运营,许多公司正在转向生物质、氢和生物燃料等环保燃料替代品。
工业锅炉市场的製造商正在透过开发下一代锅炉系统来应对这些不断变化的趋势,以优化燃料消耗并最大限度地减少排放。工业基础设施资本投资的增加,特别是新兴经济体的工业基础设施资本投资的增加,进一步推动了市场扩张。化学加工、食品饮料和发电等行业正在优先考虑符合永续发展目标并提高营运效率的先进加热解决方案。随着企业寻求符合全球排放要求的经济高效、节能的系统,对高性能工业锅炉的需求预计会增加。
| 市场范围 | |
|---|---|
| 起始年份 | 2024 |
| 预测年份 | 2025-2034 |
| 起始值 | 110亿美元 |
| 预测值 | 173亿美元 |
| 复合年增长率 | 4.5% |
工业锅炉市场根据燃料类型细分,包括天然气、石油和煤炭。预计到 2034 年,天然气领域的复合年增长率将达到 5%,这主要得益于液化天然气 (LNG) 基础设施的快速扩张以及政府推广低排放燃料替代品的激励措施。随着各行各业面临越来越大的减少碳足迹的压力,人们越来越倾向于使用性能卓越且符合严格环境标准的先进锅炉。此外,要求更好的锅炉性能认证的安全法规正在鼓励各行各业采用技术先进的系统。
从技术面来看,工业锅炉市场分为冷凝锅炉和非冷凝锅炉。冷凝工业锅炉领域在 2024 年占据了 82.7% 的市场份额,预计未来几年将实现显着成长。这些锅炉的设计旨在提高运作效率,减少燃料消耗并降低温室气体排放。它们能够捕获和重新利用废气中的热量,从而节省能源,使其成为工业应用的一个有吸引力的选择。随着企业优先考虑永续性,冷凝锅炉因其对环境的影响较小且具有长期成本效益而越来越受欢迎。
美国工业锅炉市场价值预计在 2022 年达到 14 亿美元,随着各行各业对节能供热基础设施的投资,该市场将继续成长。更严格的能源效率要求和永续营运的推动正在推动采用先进的加热技术来满足空间和水加热需求。高性能工业锅炉在提高营运效率方面发挥着至关重要的作用,从而促进了该地区的市场成长。随着各行各业对其供暖系统进行现代化改造以符合不断变化的法规,对创新和环保锅炉技术的需求将激增,从而进一步加强美国工业锅炉市场。
目录
第一章:方法论与范围
第二章:执行摘要
第三章:行业洞察
- 产业生态系统分析
- 监管格局
- 产业衝击力
- 成长动力
- 产业陷阱与挑战
- 成长潜力分析
- 波特的分析
- PESTEL分析
第四章:竞争格局
- 介绍
- 战略展望
- 创新与永续发展格局
第五章:市场规模及预测:依产品,2021 年至 2034 年
- 主要趋势
- 火管
- 按容量
- < 10 百万英热单位/小时
- 10 - 25 百万英热单位/小时
- 25 - 50 百万英热单位/小时
- 50 - 75 百万英热单位/小时
- 75 - 100 百万英热单位/小时
- 100 - 175 百万英热单位/小时
- 175 - 250 百万英热单位/小时
- > 250 百万英热单位/小时
- 按应用
- 食品加工
- 纸浆和造纸
- 化学
- 炼油厂
- 原生金属
- 其他的
- 依技术
- 冷凝
- 无凝结
- 按燃料
- 天然气
- 油
- 煤炭
- 其他的
- 按容量
- 水管
- 按容量
- < 10 百万英热单位/小时
- 10 - 25 百万英热单位/小时
- 25 - 50 百万英热单位/小时
- 50 - 75 百万英热单位/小时
- 75 - 100 百万英热单位/小时
- 100 - 175 百万英热单位/小时
- 175 - 250 百万英热单位/小时
- > 250 百万英热单位/小时
- 按应用
- 食品加工
- 纸浆和造纸
- 化学
- 炼油厂
- 原生金属
- 其他的
- 依技术
- 冷凝
- 无凝结
- 按燃料
- 天然气
- 油
- 煤炭
- 其他的
- 按容量
第六章:市场规模及预测:依产能,2021 年至 2034 年
- 主要趋势
- < 10 百万英热单位/小时
- 10 - 25 百万英热单位/小时
- 25 - 50 百万英热单位/小时
- 50 - 75 百万英热单位/小时
- 75 - 100 百万英热单位/小时
- 100 - 175 百万英热单位/小时
- 175 - 250 百万英热单位/小时
- > 250 百万英热单位/小时
第七章:市场规模及预测:依应用,2021 年至 2034 年
- 主要趋势
- 食品加工
- 纸浆和造纸
- 化学
- 炼油厂
- 原生金属
- 其他的
第八章:市场规模及预测:依燃料,2021 年至 2034 年
- 主要趋势
- 天然气
- 油
- 煤炭
- 其他的
第九章:市场规模及预测:依技术分类,2021 年至 2034 年
- 主要趋势
- 冷凝
- 无凝结
第 10 章:市场规模与预测:按地区,2021 年至 2034 年
- 主要趋势
- 北美洲
- 我们
- 加拿大
- 墨西哥
- 欧洲
- 法国
- 英国
- 波兰
- 义大利
- 西班牙
- 奥地利
- 德国
- 瑞典
- 俄罗斯
- 亚太地区
- 中国
- 印度
- 菲律宾
- 日本
- 韩国
- 澳洲
- 印尼
- 中东和非洲
- 沙乌地阿拉伯
- 伊朗
- 阿联酋
- 奈及利亚
- 南非
- 拉丁美洲
- 巴西
- 阿根廷
- 智利
第 11 章:公司简介
- Babcock and Wilcox
- Bharat Heavy Electricals
- Bosch Industriekessel
- Clayton Industries
- Cleaver-Brooks
- Cochran
- Doosan Heavy Industries and Construction
- Ferroli
- Fondital
- Fonderie Sime
- Forbes Marshall
- Fulton
- Groupe Atlantic
- General Electric
- Hoval
- Hurst Boiler & Welding
- IHI Corporation
- John Cockerill
- John Wood Group
- Mitsubishi Heavy Industries
- Miura America
- Rentech Boilers
- Siemens
- Sofinter
- Thermax
- Victory Energy Operations
- Viessmann Climate Solutions
- Walchandnagar Industries
The global industrial boiler market generated USD 11 billion in 2024 and is projected to grow at a CAGR of 4.5% between 2025 and 2034. The market is experiencing steady growth as industries increasingly focus on sustainability, energy efficiency, and compliance with stricter environmental regulations. As climate change concerns escalate, governments worldwide are implementing stringent emission standards for pollutants such as nitrogen oxides (NOx), sulfur oxides (SOx), and carbon dioxide (CO2). These regulatory measures are compelling industrial facilities to adopt cleaner and more efficient boiler technologies, driving significant demand across various sectors. Additionally, the global shift toward renewable energy sources is transforming industrial operations, with many companies transitioning to eco-friendly fuel alternatives such as biomass, hydrogen, and biofuels.
Manufacturers in the industrial boiler market are responding to these evolving trends by developing next-generation boiler systems that optimize fuel consumption while minimizing emissions. Rising capital investments in industrial infrastructure, particularly in emerging economies, are further fueling market expansion. Industries such as chemical processing, food and beverage, and power generation are prioritizing advanced heating solutions that align with sustainability goals and enhance operational efficiency. The demand for high-performance industrial boilers is expected to rise as businesses seek cost-effective, energy-efficient systems that comply with global emission mandates.
| Market Scope | |
|---|---|
| Start Year | 2024 |
| Forecast Year | 2025-2034 |
| Start Value | $11 Billion |
| Forecast Value | $17.3 Billion |
| CAGR | 4.5% |
The industrial boiler market is segmented based on fuel type, including natural gas, oil, and coal. The natural gas segment is anticipated to witness a CAGR of 5% by 2034, largely driven by the rapid expansion of liquefied natural gas (LNG) infrastructure and government incentives promoting low-emission fuel alternatives. As industries face mounting pressure to reduce their carbon footprint, there is a growing preference for advanced boilers that offer superior performance while adhering to stringent environmental standards. Additionally, safety regulations mandating better boiler performance certifications are encouraging the adoption of technologically advanced systems across industries.
In terms of technology, the industrial boiler market is classified into condensing and non-condensing boilers. The condensing industrial boiler segment held an 82.7% market share in 2024 and is expected to see remarkable growth in the coming years. These boilers are designed to operate with higher efficiency, reducing fuel consumption and lowering greenhouse gas emissions. Their ability to capture and reuse heat from exhaust gases enhances energy savings, making them an attractive choice for industrial applications. As businesses prioritize sustainability, condensing boilers are gaining traction due to their lower environmental impact and long-term cost benefits.
U.S. industrial boiler market, valued at USD 1.4 billion in 2022, continues to grow as industries invest in energy-efficient heating infrastructure. Stricter energy efficiency mandates and the push for sustainable operations are driving the adoption of advanced heating technologies to meet space and water heating demands. High-performance industrial boilers are playing a crucial role in improving operational efficiency, thus reinforcing market growth in the region. As industries modernize their heating systems to comply with evolving regulations, the demand for innovative and eco-friendly boiler technologies is set to surge, further strengthening the industrial boiler market in the United States.
Table of Contents
Chapter 1 Methodology & Scope
- 1.1 Market scope & definitions
- 1.2 Market estimates & forecast parameters
- 1.3 Forecast calculation
- 1.4 Data sources
- 1.4.1 Primary
- 1.4.2 Secondary
- 1.4.2.1 Paid
- 1.4.2.2 Public
Chapter 2 Executive Summary
- 2.1 Industry synopsis, 2021 - 2034
Chapter 3 Industry Insights
- 3.1 Industry ecosystem analysis
- 3.2 Regulatory landscape
- 3.3 Industry impact forces
- 3.3.1 Growth drivers
- 3.3.2 Industry pitfalls & challenges
- 3.4 Growth potential analysis
- 3.5 Porter's analysis
- 3.5.1 Bargaining power of suppliers
- 3.5.2 Bargaining power of buyers
- 3.5.3 Threat of new entrants
- 3.5.4 Threat of substitutes
- 3.6 PESTEL Analysis
Chapter 4 Competitive Landscape, 2025
- 4.1 Introduction
- 4.2 Strategic outlook
- 4.3 Innovation & sustainability landscape
Chapter 5 Market Size and Forecast, By Product, 2021 – 2034 (Units, MMBtu/hr & USD Million)
- 5.1 Key trends
- 5.2 Fire-tube
- 5.2.1 By capacity
- 5.2.1.1 < 10 MMBtu/hr
- 5.2.1.2 10 - 25 MMBtu/hr
- 5.2.1.3 25 - 50 MMBtu/hr
- 5.2.1.4 50 - 75 MMBtu/hr
- 5.2.1.5 75 - 100 MMBtu/hr
- 5.2.1.6 100 - 175 MMBtu/hr
- 5.2.1.7 175 - 250 MMBtu/hr
- 5.2.1.8 > 250 MMBtu/hr
- 5.2.2 By application
- 5.2.2.1 Food processing
- 5.2.2.2 Pulp & paper
- 5.2.2.3 Chemical
- 5.2.2.4 Refinery
- 5.2.2.5 Primary metal
- 5.2.2.6 Others
- 5.2.3 By technology
- 5.2.3.1 Condensing
- 5.2.3.2 Non-condensing
- 5.2.4 By fuel
- 5.2.4.1 Natural gas
- 5.2.4.2 Oil
- 5.2.4.3 Coal
- 5.2.4.4 Others
- 5.2.1 By capacity
- 5.3 Water-tube
- 5.3.1 By capacity
- 5.3.1.1 < 10 MMBtu/hr
- 5.3.1.2 10 - 25 MMBtu/hr
- 5.3.1.3 25 - 50 MMBtu/hr
- 5.3.1.4 50 - 75 MMBtu/hr
- 5.3.1.5 75 - 100 MMBtu/hr
- 5.3.1.6 100 - 175 MMBtu/hr
- 5.3.1.7 175 - 250 MMBtu/hr
- 5.3.1.8 > 250 MMBtu/hr
- 5.3.2 By application
- 5.3.2.1 Food processing
- 5.3.2.2 Pulp & paper
- 5.3.2.3 Chemical
- 5.3.2.4 Refinery
- 5.3.2.5 Primary metal
- 5.3.2.6 Others
- 5.3.3 By technology
- 5.3.3.1 Condensing
- 5.3.3.2 Non-condensing
- 5.3.4 By fuel
- 5.3.4.1 Natural gas
- 5.3.4.2 Oil
- 5.3.4.3 Coal
- 5.3.4.4 Others
- 5.3.1 By capacity
Chapter 6 Market Size and Forecast, By Capacity, 2021 – 2034 (Units, MMBtu/hr & USD Million)
- 6.1 Key trends
- 6.2 < 10 MMBtu/hr
- 6.3 10 - 25 MMBtu/hr
- 6.4 25 - 50 MMBtu/hr
- 6.5 50 - 75 MMBtu/hr
- 6.6 75 - 100 MMBtu/hr
- 6.7 100 - 175 MMBtu/hr
- 6.8 175 - 250 MMBtu/hr
- 6.9 > 250 MMBtu/hr
Chapter 7 Market Size and Forecast, By Application, 2021 – 2034 (Units, MMBtu/hr & USD Million)
- 7.1 Key trends
- 7.2 Food processing
- 7.3 Pulp & paper
- 7.4 Chemical
- 7.5 Refinery
- 7.6 Primary metal
- 7.7 Others
Chapter 8 Market Size and Forecast, By Fuel, 2021 – 2034 (Units, MMBtu/hr & USD Million)
- 8.1 Key trends
- 8.2 Natural gas
- 8.3 Oil
- 8.4 Coal
- 8.5 Others
Chapter 9 Market Size and Forecast, By Technology, 2021 – 2034 (Units, MMBtu/hr & USD Million)
- 9.1 Key trends
- 9.2 Condensing
- 9.3 Non-condensing
Chapter 10 Market Size and Forecast, By Region, 2021 – 2034 (Units, MMBtu/hr & USD Million)
- 10.1 Key trends
- 10.2 North America
- 10.2.1 U.S.
- 10.2.2 Canada
- 10.2.3 Mexico
- 10.3 Europe
- 10.3.1 France
- 10.3.2 UK
- 10.3.3 Poland
- 10.3.4 Italy
- 10.3.5 Spain
- 10.3.6 Austria
- 10.3.7 Germany
- 10.3.8 Sweden
- 10.3.9 Russia
- 10.4 Asia Pacific
- 10.4.1 China
- 10.4.2 India
- 10.4.3 Philippines
- 10.4.4 Japan
- 10.4.5 South Korea
- 10.4.6 Australia
- 10.4.7 Indonesia
- 10.5 Middle East & Africa
- 10.5.1 Saudi Arabia
- 10.5.2 Iran
- 10.5.3 UAE
- 10.5.4 Nigeria
- 10.5.5 South Africa
- 10.6 Latin America
- 10.6.1 Brazil
- 10.6.2 Argentina
- 10.6.3 Chile
Chapter 11 Company Profiles
- 11.1 Babcock and Wilcox
- 11.2 Bharat Heavy Electricals
- 11.3 Bosch Industriekessel
- 11.4 Clayton Industries
- 11.5 Cleaver-Brooks
- 11.6 Cochran
- 11.7 Doosan Heavy Industries and Construction
- 11.8 Ferroli
- 11.9 Fondital
- 11.10 Fonderie Sime
- 11.11 Forbes Marshall
- 11.12 Fulton
- 11.13 Groupe Atlantic
- 11.14 General Electric
- 11.15 Hoval
- 11.16 Hurst Boiler & Welding
- 11.17 IHI Corporation
- 11.18 John Cockerill
- 11.19 John Wood Group
- 11.20 Mitsubishi Heavy Industries
- 11.21 Miura America
- 11.22 Rentech Boilers
- 11.23 Siemens
- 11.24 Sofinter
- 11.25 Thermax
- 11.26 Victory Energy Operations
- 11.27 Viessmann Climate Solutions
- 11.28 Walchandnagar Industries
 工业锅炉维护市场规模、份额和成长分析(按类型、服务、最终用户和地区划分)-2026-2033年产业预测
 工业锅炉市场规模、份额和成长分析(按锅炉类型、功能、燃料类型、额定容量、锅炉马力、技术和地区划分)—2026-2033年产业预测
 工业锅炉市场(按锅炉类型、燃料类型、设计类型、容量、技术、组件、最终用途行业和安装类型划分)—全球预测,2025-2032年
 2025年全球工业锅炉市场报告
 全球工业火管低温锅炉市场全球工业锅炉维修市场全球低温工业锅炉市场
 工业锅炉市场规模、份额和趋势分析报告:按容量、锅炉类型、类型、燃料、应用、地区和细分市场预测,2025 年至 2033 年全球冷凝式低温商用锅炉市场全球工业用燃气水管锅炉市场