


 |
市场调查报告书
商品编码
1716594
充气城堡市场机会、成长动力、产业趋势分析及 2025 - 2034 年预测Bounce House Market Opportunity, Growth Drivers, Industry Trend Analysis, and Forecast 2025 - 2034 |
||||||
2024 年全球充气城堡市场规模达 42 亿美元,预估 2025-2034 年期间复合年增长率为 4.1%。随着全球对充气娱乐解决方案的需求不断增长,市场持续保持稳定成长。随着越来越多的家庭为孩子寻求安全、有趣且价格合理的娱乐选择,充气城堡已成为首选,为各种场合提供充满乐趣的体验。充气城堡的流行也与越来越多的游乐园、家庭娱乐中心和室内游乐场有关,这些游乐园、家庭娱乐中心和室内游乐场正在扩大其服务范围,以吸引更年轻的观众。
这些充气景点具有多种主题和设计,不仅限于商业场所 - 它们现在已成为生日派对、学校活动、公司家庭活动和社区节日的常见特色。充气城堡色彩鲜艳、主题有趣、功能可客製化,深受注重安全和娱乐的儿童和家长的青睐。製造商也专注于推出将乐趣与安全相结合的创新设计,使用符合国际安全标准的高品质、耐用的材料。可支配收入的增加和对儿童娱乐活动的高度关注进一步推动了市场的成长,尤其是在户外游乐场所有限的城市地区。
| 市场范围 | |
|---|---|
| 起始年份 | 2024 |
| 预测年份 | 2025-2034 |
| 起始值 | 42亿美元 |
| 预测值 | 62亿美元 |
| 复合年增长率 | 4.1% |
充气城堡市场根据产品类型进行细分,包括带有滑梯的充气城堡、不带滑梯的充气城堡、障碍赛道、组合充气城堡和其他充气城堡。 2024 年,不含滑梯的充气城堡的收入为 16 亿美元,预计到 2034 年将达到 24 亿美元。这些模型因其多功能性和广泛的吸引力而越来越受欢迎。无滑梯的充气城堡配有攀岩墙、互动障碍物和创意主题等功能,是生日派对、学校嘉年华和教堂聚会等各种活动的首选。它们外观设计美观且易于安装,非常适合室内和室外使用,因此广受欢迎。
根据年龄段,充气城堡市场分为 4 岁以下、4-8 岁和 8 岁以上类别。 2024 年,4-8 岁年龄组占据了 44% 的主导市场。该细分市场的充气城堡旨在满足儿童高能量游戏需求,提供安全且令人兴奋的环境,促进儿童积极玩耍。对于 4 岁以下的儿童,製造商专注于创造柔软、低矮的结构,以促进运动技能发展和社交互动。对于年龄较大的孩子来说,带有更多冒险元素(如障碍赛和具有挑战性的攀爬)的充气城堡可以满足他们对刺激游戏体验的需求。
美国充气城堡市场预计以每年 3.8% 的复合年增长率成长。作为充气娱乐的主要市场,美国受益于强大的供应链和提供主题和客製化充气城堡设计的众多供应商。消费者在休閒和娱乐活动上的支出不断增加,加上严格的安全法规和品质标准,继续推动该国的市场成长。
目录
第一章:方法论与范围
第二章:执行摘要
第三章:行业洞察
- 产业生态系统分析
- 影响价值链的因素
- 利润率分析
- 中断
- 未来展望
- 製造商
- 经销商
- 零售商
- 衝击力
- 成长动力
- 增加可支配收入
- 租赁机构不断成长
- 不断增长的游乐园
- 产业陷阱与挑战
- 天气敏感性
- 市场饱和
- 成长动力
- 消费者购买行为分析
- 人口趋势
- 影响购买决策的因素
- 消费者产品采用
- 首选配销通路
- 首选价格范围
- 成长潜力分析
- 监管格局
- 定价分析
- 波特的分析
- PESTEL分析
第四章:竞争格局
- 介绍
- 公司市占率分析
- 竞争定位矩阵
- 战略展望矩阵
第五章:市场估计与预测:按类型,2021 年至 2034 年
- 主要趋势
- 附幻灯片
- 无幻灯片
- 障碍赛
- 连击
- 其他的
第六章:市场估计与预测:依年龄组,2021-2034 年
- 主要趋势
- 最多 4 年
- 4-8岁
- 8岁以上
第七章:市场估计与预测:依价格区间,2021-2034
- 主要趋势
- 低(最高 500 美元)
- 中(500-1000美元)
- 高(超过 1000 美元)
第八章:市场估计与预测:依最终用途,2021-2034
- 主要趋势
- 个人
- 商业的
第九章:市场估计与预测:按配销通路,2021-2034
- 主要趋势
- 在线的
- 离线
第十章:市场估计与预测:按地区,2021 年至 2034 年
- 主要趋势
- 北美洲
- 我们
- 加拿大
- 欧洲
- 英国
- 德国
- 法国
- 义大利
- 西班牙
- 亚太地区
- 中国
- 日本
- 印度
- 韩国
- 澳洲
- 拉丁美洲
- 巴西
- 墨西哥
- MEA
- 南非
- 沙乌地阿拉伯
- 阿联酋
第 11 章:公司简介
- B-Air
- Blast Zone
- Bouncer Depot
- Cloud 9
- Commercial Inflatable
- Cutting Edge Creations
- EZ Inflatables
- HEC Worldwide
- House of Bounce
- Inflatable Depot
- Jungle Jumps
- Magic Jump
- Ninja Jump
- Tent and Table
- Ultimate Jumpers
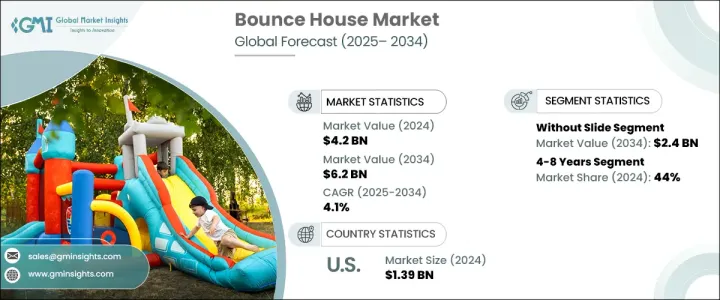
The Global Bounce House Market reached USD 4.2 billion in 2024 and is expected to grow at a CAGR of 4.1% during 2025-2034. The market continues to witness steady growth as the demand for inflatable entertainment solutions rises worldwide. As families increasingly seek safe, engaging, and affordable entertainment options for children, bounce houses have emerged as a top choice, offering fun-filled experiences for various occasions. The popularity of bounce houses is also tied to the growing number of amusement parks, family entertainment centers, and indoor playgrounds that are expanding their offerings to attract younger audiences.
These inflatable attractions, available in a wide range of themes and designs, are not just limited to commercial venues - they are now a common feature at birthday parties, school functions, corporate family events, and community festivals. With their vibrant colors, playful themes, and customizable features, bounce houses appeal to both children and parents who prioritize safety and enjoyment. Manufacturers are also focusing on introducing innovative designs that combine fun with safety, using high-quality, durable materials that comply with international safety standards. The market's growth is further supported by rising disposable incomes and a heightened focus on recreational activities for children, especially in urban areas where outdoor play spaces may be limited.
| Market Scope | |
|---|---|
| Start Year | 2024 |
| Forecast Year | 2025-2034 |
| Start Value | $4.2 Billion |
| Forecast Value | $6.2 Billion |
| CAGR | 4.1% |
The bounce house market is segmented based on product types, including bounce houses with slides, without slides, obstacle courses, combos, and others. Bounce houses without slides accounted for USD 1.6 billion in revenue in 2024 and are projected to generate USD 2.4 billion by 2034. These models are gaining traction for their versatility and broad appeal. Equipped with features like climbing walls, interactive obstacles, and creative themes, bounce houses without slides are a preferred choice for various events, including birthday parties, school carnivals, and church gatherings. Their visually attractive designs and ease of setup make them ideal for both indoor and outdoor use, contributing to their widespread popularity.
By age group, the bounce house market is divided into up to 4 years, 4-8 years, and over 8 years categories. The 4-8 years age group held a dominant 44% market share in 2024. Bounce houses in this segment are designed to meet the high-energy play needs of children, offering safe yet exciting environments that foster active play. For children under 4 years old, manufacturers focus on creating soft, low-height structures that encourage motor skill development and social interaction. For older children, bounce houses with more adventurous elements like obstacle courses and challenging climbs cater to their demand for thrilling play experiences.
The U.S. Bounce House Market is set to grow at a CAGR of 3.8% annually. As the leading market for inflatable entertainment, the U.S. benefits from a strong supply chain and a wide range of suppliers offering themed and customized bounce house designs. Rising consumer spending on leisure and recreational activities, combined with stringent safety regulations and quality standards, continues to drive market growth in the country.
Table of Contents
Chapter 1 Methodology & Scope
- 1.1 Market scope & definition
- 1.2 Base estimates & calculations
- 1.3 Forecast parameters
- 1.4 Data sources
- 1.4.1 Primary
- 1.5 Secondary
- 1.5.1.1 Paid sources
- 1.5.1.2 Public sources
Chapter 2 Executive Summary
- 2.1 Industry synopsis, 2021 - 2034
Chapter 3 Industry Insights
- 3.1 Industry ecosystem analysis
- 3.1.1 Factor affecting the value chain
- 3.1.2 Profit margin analysis
- 3.1.3 Disruptions
- 3.1.4 Future outlook
- 3.1.5 Manufacturers
- 3.1.6 Distributors
- 3.1.7 Retailers
- 3.2 Impact forces
- 3.2.1 Growth drivers
- 3.2.1.1 Increasing disposable income
- 3.2.1.2 Growing rental agencies
- 3.2.1.3 Growing amusement parks
- 3.2.2 Industry pitfalls & challenges
- 3.2.2.1 Weather sensitivity
- 3.2.2.2 Market saturation
- 3.2.1 Growth drivers
- 3.3 Consumer buying behavior analysis
- 3.3.1 Demographic trends
- 3.3.2 Factors affecting buying decision
- 3.3.3 Consumer product adoption
- 3.3.4 Preferred distribution channel
- 3.3.5 Preferred price range
- 3.4 Growth potential analysis
- 3.5 Regulatory landscape
- 3.6 Pricing analysis
- 3.7 Porter's analysis
- 3.8 PESTEL analysis
Chapter 4 Competitive Landscape, 2024
- 4.1 Introduction
- 4.2 Company market share analysis
- 4.3 Competitive positioning matrix
- 4.4 Strategic outlook matrix
Chapter 5 Market Estimates and Forecast, By Type, 2021 – 2034 (USD Billion) (Million Units)
- 5.1 Key trends
- 5.2 With slide
- 5.3 Without slide
- 5.4 Obstacle course
- 5.5 Combo
- 5.6 Others
Chapter 6 Market Estimates & Forecast, By Age Group, 2021-2034 (USD Billion) (Million Units)
- 6.1 Key trends
- 6.2 Upto 4 years
- 6.3 4-8 years
- 6.4 Above 8 years
Chapter 7 Market Estimates & Forecast, By Price Range, 2021-2034 (USD Billion) (Million Units)
- 7.1 Key trends
- 7.2 Low (upto 500$)
- 7.3 Mid (500$-1000$)
- 7.4 High (more than 1000$)
Chapter 8 Market Estimates & Forecast, By End Use, 2021-2034 (USD Billion) (Million Units)
- 8.1 Key trends
- 8.2 Individual
- 8.3 Commercial
Chapter 9 Market Estimates & Forecast, By Distribution Channel, 2021-2034 (USD Billion) (Million Units)
- 9.1 Key trends
- 9.2 Online
- 9.3 Offline
Chapter 10 Market Estimates & Forecast, By Region, 2021 – 2034, (USD Billion) (Million Units)
- 10.1 Key trends
- 10.2 North America
- 10.2.1 U.S.
- 10.2.2 Canada
- 10.3 Europe
- 10.3.1 UK
- 10.3.2 Germany
- 10.3.3 France
- 10.3.4 Italy
- 10.3.5 Spain
- 10.4 Asia Pacific
- 10.4.1 China
- 10.4.2 Japan
- 10.4.3 India
- 10.4.4 South Korea
- 10.4.5 Australia
- 10.5 Latin America
- 10.5.1 Brazil
- 10.5.2 Mexico
- 10.6 MEA
- 10.6.1 South Africa
- 10.6.2 Saudi Arabia
- 10.6.3 UAE
Chapter 11 Company Profiles (Business Overview, Financial Data, Product Landscape, Strategic Outlook, SWOT Analysis)
- 11.1 B-Air
- 11.2 Blast Zone
- 11.3 Bouncer Depot
- 11.4 Cloud 9
- 11.5 Commercial Inflatable
- 11.6 Cutting Edge Creations
- 11.7 EZ Inflatables
- 11.8 HEC Worldwide
- 11.9 House of Bounce
- 11.10 Inflatable Depot
- 11.11 Jungle Jumps
- 11.12 Magic Jump
- 11.13 Ninja Jump
- 11.14 Tent and Table
- 11.15 Ultimate Jumpers


