


 |
市场调查报告书
商品编码
1716598
非酒精饮料包装市场机会、成长动力、产业趋势分析及 2025 - 2034 年预测Non-alcoholic Beverage Packaging Market Opportunity, Growth Drivers, Industry Trend Analysis, and Forecast 2025 - 2034 |
||||||
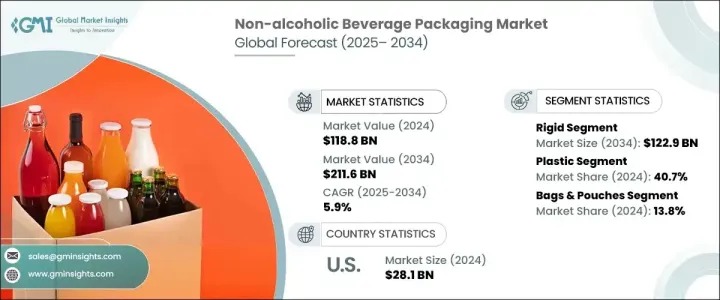
2024 年全球非酒精饮料包装市场规模达到 1,188 亿美元,预计 2025 年至 2034 年期间的复合年增长率为 5.9%。随着消费者偏好转向更健康的饮料选择,对创新和永续包装解决方案的需求正在上升。各大品牌正积极应对低糖饮料、真果汁饮料和功能性饮料日益增长的受欢迎程度,采用能够保持新鲜度、确保营养完整性并符合严格监管要求的包装。随着企业致力于提高便利性,同时尽量减少对环境的影响,环保材料和定量包装形式的趋势进一步推动了市场的发展。
随着注重健康的消费者推动对功能性饮料的需求,品牌越来越多地利用包装作为增强产品吸引力和永续性的策略工具。能量饮料、调味水和低热量食品的日益流行,使得包装不仅需要保持产品的完整性,还需要满足不断变化的消费者期望。随着饮料公司寻求在便利性和环境责任之间取得平衡,轻质、可回收材料、可生物降解的选择和永续包装创新正在迅速获得关注。
| 市场范围 | |
|---|---|
| 起始年份 | 2024 |
| 预测年份 | 2025-2034 |
| 起始值 | 1188亿美元 |
| 预测值 | 2116亿美元 |
| 复合年增长率 | 5.9% |
市场分为硬质包装和软包装类型,预计到 2034 年硬质包装的产值将达到 1,229 亿美元。硬质包装因其耐用性、卓越的产品保护和多功能性仍然是首选,使其成为优质和功能性饮料的理想解决方案。随着对高品质饮料的需求不断增长,製造商正在采用铝和玻璃等永续材料来满足具有环保意识的消费者的需求。这一趋势在高端果汁和功能性饮料领域尤其明显,品牌强调包装的美观、可回收性和产品差异化。
2024 年,塑胶包装占据非酒精饮料包装市场的 40.7%,因其价格实惠和适应性而保持主导地位。然而,围绕不可生物降解塑胶废物日益增长的环境问题促使製造商转向可持续的替代品。随着各公司投资可再填充和可重复使用的塑胶瓶计划,再生 PET (rPET) 和生物塑胶的采用势头日益强劲。这些努力符合全球永续发展目标,同时确保为寻求便携和随时饮料选择的消费者提供持续的便利。
2024 年,北美在非酒精饮料包装市场占有 27.1% 的份额,巩固了其作为关键区域参与者的地位。该地区的市场扩张是由消费者对永续包装的强劲需求以及对迎合快节奏生活方式的单份和便携式形式的偏好所推动的。环保材料、智慧包装技术和功能性饮料包装解决方案的不断创新进一步加强了北美在塑造全球产业趋势中的作用。
目录
第一章:方法论与范围
第二章:执行摘要
第三章:行业洞察
- 产业生态系统分析
- 产业衝击力
- 成长动力
- 软性饮料销量增加
- 转向随时随地的消费习惯
- 对健康饮料的需求不断增长
- 罐装非酒精饮料的激增
- 成人软性饮料日益流行
- 产业陷阱与挑战
- 原物料价格波动和严格的环境法规
- 塑胶的环境影响
- 成长动力
- 成长潜力分析
- 监管格局
- 技术格局
- 未来市场趋势
- 差距分析
- 波特的分析
- PESTEL分析
第四章:竞争格局
- 介绍
- 公司市占率分析
- 主要市场参与者的竞争分析
- 竞争定位矩阵
- 策略仪表板
第五章:市场估计与预测:按类型,2021 - 2034 年
- 主要趋势
- 死板的
- 灵活的
第六章:市场估计与预测:按材料,2021 - 2034 年
- 主要趋势
- 塑胶
- 宠物
- 聚丙烯
- 高密度聚乙烯
- 低密度聚乙烯
- 其他的
- 金属
- 玻璃
- 纸和纸板
- 其他的
第七章:市场估计与预测:按产品,2021 - 2034 年
- 主要趋势
- 包包和小袋
- 瓶子和罐子
- 罐头
- 桶和鼓
- 盒子和纸箱
- 其他的
第八章:市场估计与预测:按应用,2021 - 2034 年
- 主要趋势
- 碳酸软性饮料
- 果汁
- 即饮茶和咖啡
- 功能性饮料
- 乳製品
- 其他的
第九章:市场估计与预测:按地区,2021 - 2034 年
- 主要趋势
- 北美洲
- 我们
- 加拿大
- 欧洲
- 德国
- 英国
- 法国
- 西班牙
- 义大利
- 荷兰
- 亚太地区
- 中国
- 印度
- 日本
- 澳洲
- 韩国
- 拉丁美洲
- 巴西
- 墨西哥
- 阿根廷
- 中东和非洲
- 沙乌地阿拉伯
- 南非
- 阿联酋
第十章:公司简介
- Anchor Glass Container
- Airlite Plastics
- Ardagh Group
- Ball Corporation
- Can Corporation of America
- Can Pack Group
- CL Smith
- Crown Holdings
- Envases Group
- International Paper
- Mondi
- OI Glass
- Pactiv Evergreen
- Silgan Containers
- Smurfit Kappa
- Stora Enso
- Tetra Pak
- Verallia
- WestRock
The Global Non-Alcoholic Beverage Packaging Market reached USD 118.8 billion in 2024 and is projected to grow at a CAGR of 5.9% between 2025 and 2034. As consumer preferences shift toward healthier beverage choices, the demand for innovative and sustainable packaging solutions is on the rise. Brands are actively responding to the growing popularity of low-sugar drinks, real juice beverages, and functional drinks by adopting packaging that preserves freshness, ensures nutritional integrity, and meets stringent regulatory requirements. The trend toward eco-friendly materials and portion-controlled packaging formats further fuels the market, as companies aim to enhance convenience while minimizing environmental impact.
With health-conscious consumers driving the demand for functional beverages, brands are increasingly leveraging packaging as a strategic tool to enhance product appeal and sustainability. The rising popularity of energy drinks, flavored water, and low-calorie options has created a need for packaging that not only maintains product integrity but also aligns with evolving consumer expectations. Lightweight, recyclable materials, biodegradable options, and sustainable packaging innovations are rapidly gaining traction as beverage companies seek to balance convenience with environmental responsibility.
| Market Scope | |
|---|---|
| Start Year | 2024 |
| Forecast Year | 2025-2034 |
| Start Value | $118.8 Billion |
| Forecast Value | $211.6 Billion |
| CAGR | 5.9% |
The market is segmented into rigid and flexible packaging types, with rigid packaging projected to generate USD 122.9 billion by 2034. Rigid packaging remains a preferred choice due to its durability, superior product protection, and versatility, making it an ideal solution for premium and functional beverages. As demand for high-quality beverages continues to rise, manufacturers are embracing sustainable materials like aluminum and glass to cater to eco-conscious consumers. This trend is particularly evident in the premium juice and functional beverage segment, where brands emphasize packaging aesthetics, recyclability, and product differentiation.
The plastic segment accounted for 40.7% of the non-alcoholic beverage packaging market in 2024, maintaining its dominance due to affordability and adaptability. However, growing environmental concerns surrounding non-biodegradable plastic waste are prompting manufacturers to transition toward sustainable alternatives. The adoption of recycled PET (rPET) and bioplastics is gaining momentum, with companies investing in refillable and reusable plastic bottle initiatives. These efforts align with global sustainability targets while ensuring continued convenience for consumers who seek portable and on-the-go beverage options.
North America held a 27.1% share in the non-alcoholic beverage packaging market in 2024, reinforcing its position as a key regional player. The market expansion in this region is driven by strong consumer demand for sustainable packaging, coupled with a preference for single-serve and on-the-go formats that cater to fast-paced lifestyles. Continuous innovation in eco-friendly materials, smart packaging technologies, and functional beverage packaging solutions further strengthens North America's role in shaping global industry trends.
Table of Contents
Chapter 1 Methodology and Scope
- 1.1 Market scope and definitions
- 1.2 Research design
- 1.2.1 Research approach
- 1.2.2 Data collection methods
- 1.3 Base estimates and calculations
- 1.3.1 Base year calculation
- 1.3.2 Key trends for market estimation
- 1.4 Forecast model
- 1.5 Primary research and validation
- 1.5.1 Primary sources
- 1.5.2 Data mining sources
Chapter 2 Executive Summary
- 2.1 Industry 3600 synopsis
Chapter 3 Industry Insights
- 3.1 Industry ecosystem analysis
- 3.2 Industry impact forces
- 3.2.1 Growth drivers
- 3.2.1.1 Increasing sales of soft drinks
- 3.2.1.2 Shift towards on-the-go consumption habits
- 3.2.1.3 Rising demand for healthier beverages
- 3.2.1.4 Proliferation of non-alcoholic beverages in cans
- 3.2.1.5 Rising popularity of adult soft drinks
- 3.2.2 Industry pitfalls and challenges
- 3.2.2.1 Volatile raw material prices and stringent environmental regulations
- 3.2.2.2 Environmental effects of plastic
- 3.2.1 Growth drivers
- 3.3 Growth potential analysis
- 3.4 Regulatory landscape
- 3.5 Technology landscape
- 3.6 Future market trends
- 3.7 Gap analysis
- 3.8 Porter's analysis
- 3.9 PESTEL analysis
Chapter 4 Competitive Landscape, 2024
- 4.1 Introduction
- 4.2 Company market share analysis
- 4.3 Competitive analysis of major market players
- 4.4 Competitive positioning matrix
- 4.5 Strategy dashboard
Chapter 5 Market Estimates and Forecast, By Type, 2021 - 2034 (USD Bn & Kilo Tons)
- 5.1 Key trends
- 5.2 Rigid
- 5.3 Flexible
Chapter 6 Market Estimates and Forecast, By Material, 2021 - 2034 (USD Bn & Kilo Tons)
- 6.1 Key trends
- 6.2 Plastic
- 6.2.1 PET
- 6.2.2 PP
- 6.2.3 HDPE
- 6.2.4 LDPE
- 6.2.5 Others
- 6.3 Metal
- 6.4 Glass
- 6.5 Paper & paperboard
- 6.6 Others
Chapter 7 Market Estimates and Forecast, By Product, 2021 - 2034 (USD Bn & Kilo Tons)
- 7.1 Key trends
- 7.2 Bags & pouch
- 7.3 Bottles & jars
- 7.4 Cans
- 7.5 Barrels & drums
- 7.6 Boxes & cartons
- 7.7 Others
Chapter 8 Market Estimates and Forecast, By Application, 2021 - 2034 (USD Bn & Kilo Tons)
- 8.1 Key trends
- 8.2 Carbonated soft drinks
- 8.3 Juices
- 8.4 Ready-to-drink tea & coffee
- 8.5 Functional drinks
- 8.6 Dairy products
- 8.7 Others
Chapter 9 Market Estimates and Forecast, By Region, 2021 - 2034 (USD Bn & Kilo Tons)
- 9.1 Key trends
- 9.2 North America
- 9.2.1 U.S.
- 9.2.2 Canada
- 9.3 Europe
- 9.3.1 Germany
- 9.3.2 UK
- 9.3.3 France
- 9.3.4 Spain
- 9.3.5 Italy
- 9.3.6 Netherlands
- 9.4 Asia Pacific
- 9.4.1 China
- 9.4.2 India
- 9.4.3 Japan
- 9.4.4 Australia
- 9.4.5 South Korea
- 9.5 Latin America
- 9.5.1 Brazil
- 9.5.2 Mexico
- 9.5.3 Argentina
- 9.6 Middle East and Africa
- 9.6.1 Saudi Arabia
- 9.6.2 South Africa
- 9.6.3 UAE
Chapter 10 Company Profiles
- 10.1 Anchor Glass Container
- 10.2 Airlite Plastics
- 10.3 Ardagh Group
- 10.4 Ball Corporation
- 10.5 Can Corporation of America
- 10.6 Can Pack Group
- 10.7 C.L. Smith
- 10.8 Crown Holdings
- 10.9 Envases Group
- 10.10 International Paper
- 10.11 Mondi
- 10.12 O-I Glass
- 10.13 Pactiv Evergreen
- 10.14 Silgan Containers
- 10.15 Smurfit Kappa
- 10.16 Stora Enso
- 10.17 Tetra Pak
- 10.18 Verallia
- 10.19 WestRock
 日本包装饮料市场规模、份额、趋势和预测:按类型、包装类型、通路和地区划分,2026-2034年
 热灌装包装全球市场报告(2026年)日本饮料包装市场报告:按材料、产品、应用和地区划分(2026-2034年)
 饮料包装创新市场预测至2032年:按材料、包装类型、创新类型、饮料类别、技术、最终用户和地区分類的全球分析
 饮料容器回收市场机会、成长驱动因素、产业趋势分析及预测(2025-2034年)
 饮料包装市场按饮料类型、材料类型、包装形式、分销管道和营运类型划分-全球预测,2025-20322032 年塑胶中性水市场预测:按产品类型、包装类型、塑胶中性机制、价格分布范围、分销管道、最终用户和地区进行的全球分析
 饮料包装:市场份额分析、行业趋势、统计数据和成长预测(2025-2030 年)2025年全球饮料包装市场报告美国饮料包装:市场份额分析、行业趋势、统计数据和成长预测(2025-2030 年)